Steemit Crypto Academy Week 4 Task | by @stream4u | Support <----> Resistance | What is Technical Indicator? | Overview Of TradingView | 200 Moving Average.
Relative Strength Index (RSI)
Introduction
Good day, everyone. It's another wonderful time to be here again after reading a lecture by the crypto professor @stream4u where he discussed in detail how in technical chart a support can become resistance, resistance becomes support, the meaning of technical indicators, overview of Tradingview and 200 moving average. It was a great lecture from him and I will do justice to the lecture by solving the tasks associated.
Task Topic 1
How Support becomes Resistance and how Resistance becomes Support
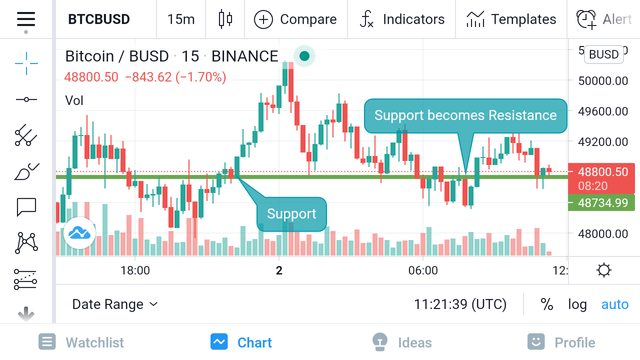
Recall that the basic knowledge of Support explains that support is the point on a chart pattern whereby the price of a crypto asset rises up thereby opening a good buy position for traders while Resistance is the point on the chart pattern at which the price of an asset come down to open a good sell position. Support becomes Resistance on the chart pattern when the price of an asset dropped below a previously drawn support line and rise back to the first drawn Support line and drop again thereby becoming a Resistance.
Example of Support becomes Resistance
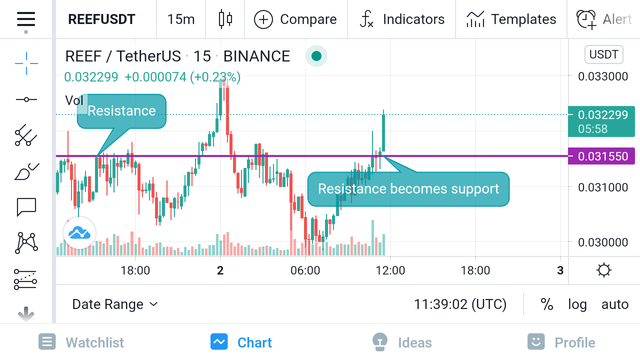
Also, Resistance becomes Support when the price of an asset breakout from the previously drawn resistance line and along the line, the price drops and the price of the assets rises again beyond the point of the previous resistance line thereby becoming a Support. It is advisable to place buy order when the resistance becomes support.
Example of Resistance becomes Support
Task Topic 2
Technical Indicators
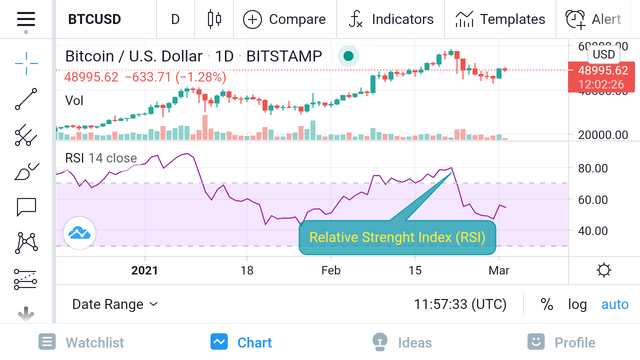
These are indications used in technical analysis on an asset chart pattern to reveal the price movement of a particular asset at a certain time. Mere buying and selling knowledge cannot be sufficient to trade and invest successfully in cryptocurrency, hence there is a need for technical indicators to give the basic insight to the price behaviour of different assets. There are many of them but I will be showing the Relative Strength Index (RSI) in the screenshot below.
Relative Strength Index (RSI)
Task Topic 3
TradingView
Tradingview is a very strong and large assets charting platform that built an avenue for traders and technical analysts to check real time price behavior of assets and it's not limited to cryptocurrency alone. It services are extended to crypto, forex, stocks and other financial markets. The platform has a lot of technical tools such as the technical indicators that shows the real time price behaviour of an asset for the use of traders so as to make a good decision for buy or sell. Tradingview is widely adopted by many technical analysts today for its large availability of great tools and indicators to analyse the financial market.
TradingView App
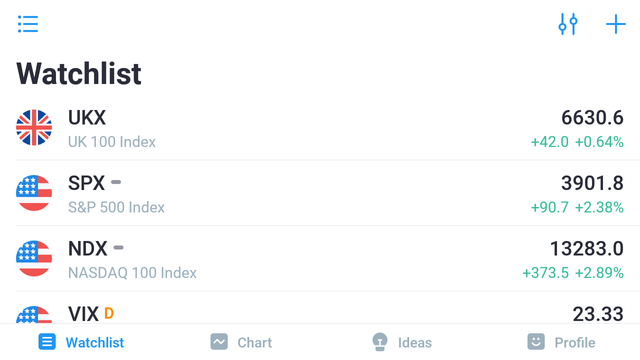
The App can be downloaded on the App Store or Google play store. After download, open it and you will have the interface below.
TradingView App landing page
To use the charts to see the charting pattern of an asset, click the second icon with charts to search for desired assets.
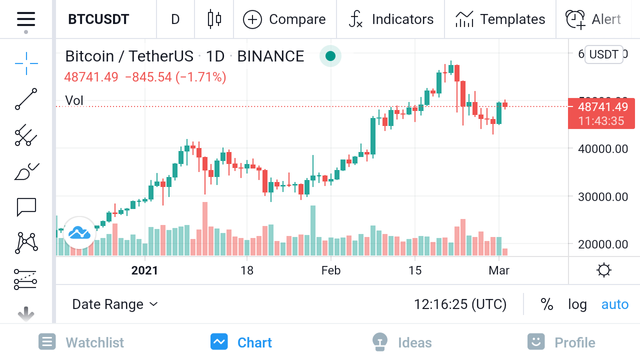
TradingView Chart page
There are several options at the top of the page and you can select the asset you are looking for by the top where a pair of BTCUSDT was written. Also, you can select different technical indicators to be used for your analysis
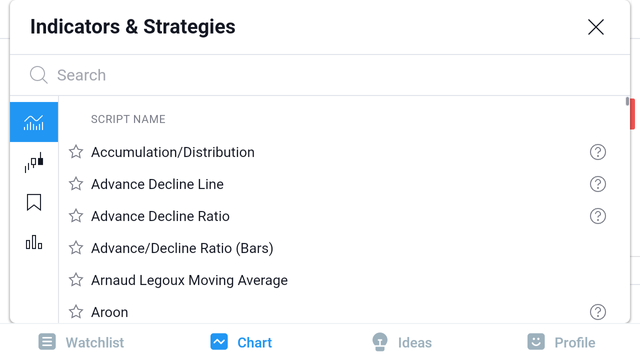
TradingView Indicators
In the screenshot above are several numbers of indicators on TradingView which you can select from the list and also search for any favourite one.
Task Topic 4
200 Moving Average
200 moving average on a chart pattern
The 200 moving average is a very strong indicator that is used for a long term projection of assets to make huge profit from the trade or investment in the nearest future. The 200 moving average is represented as a line on charts and represents the average price over the past 200 days or 40 weeks. The 200 moving average help traders to see the trend of an asset either in uptrend or downtrend and also allows them the see the supports and resistance on the chart pattern.
How to Invest or Trade with the 200 moving average
Note that, the 200 moving average is an indicator which is a drawn line that is used for a long term trading and monitoring of an asset price behaviour to make a decision of when to buy and when to sell. I will give two important points to note below.
If the price of an asset is below the 200 moving average, that's a good sell indication. Then in investing or trading, you consider selling such asset.
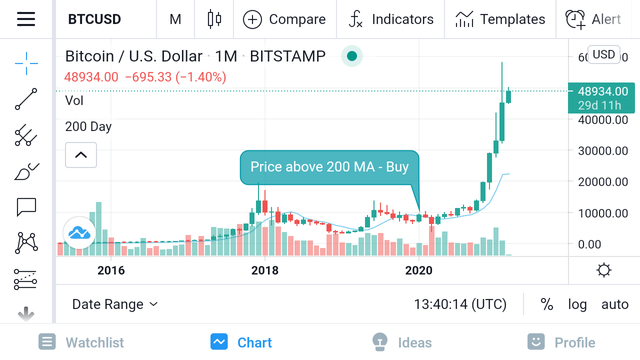
And if the price is above the 200 moving average, it's a good indicator to buying the asset. At this point, the trader should make a buy decision which is the best position of trade at the moment.
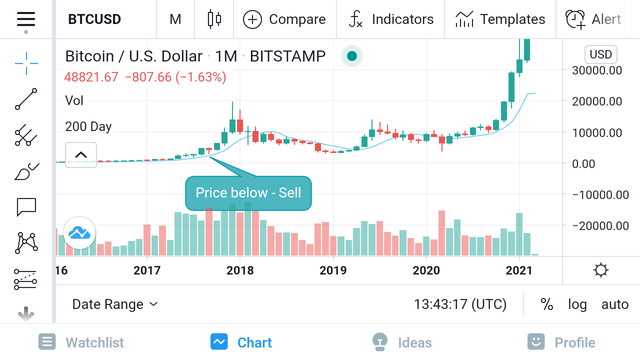
Example of BTCUSD price below the 200 MA
- The above screenshot shows the price of BTCUSD below the 200 moving average thereby open a good sell position.
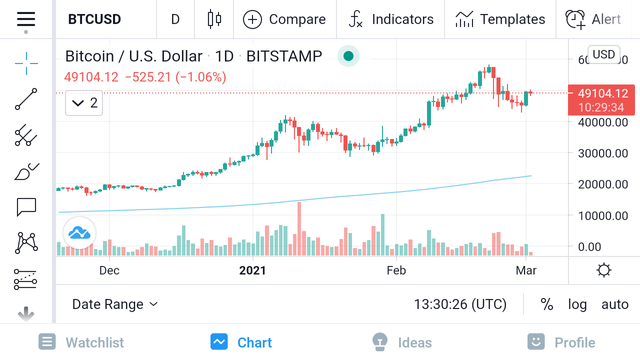
Example of BTCUSD price above the 200 MA
- The above screenshot shows the price of the asset above 200 moving average which is a good position for buy.
Thanks for reading this far. And my regards to the crypto professor @stream4u for his great teaching and I believe I've attended the task to a good extent. Thank you all.
Special regards;
Cc: @steemcurator01
Cc: @steemcurator02
Cc: @steemitblog
Cc: @stream4u-week4
Written by; @fredquantum
Hi @fredquantum
Thank you for joining Steemit Crypto Academy and participated in the Homework Task 4.
Your Homework task 4 verification has been done by @Stream4u.
Thank You.
@stream4u
Crypto Professors : Steemit Crypto Academy
Thank you professor @stream4u. I really appreciate your time to review this and I look forward to learning more from you.