Steemit Crypto Academy | Course 3 By @stream4u | What is Chart Patterns? | Price Breakout - Continuation Patterns - Reversal Patterns | STOPLOSS.

Hello All,
Hope you all are doing well. My self @stream4u, I am from India and one of your crypto professors, welcome you all to my class.
This is my third lecture Technical Analysis. Till now we learn some basics about candles, candle charts, what are they mean on the chart, how different time frames can be set in the chats, and the basic concepts of Support and Resistance.
I am really feeling good and happy with all your homework tasks, from the homework task, I can also see that the beginner level is now gaining good knowledge and command on the technical chart.
I am trying my best to make these courses as simple as possible so that new ones can also understand this easily.
It's a humble request to all interested, first understand the course then please read the homework task 2-3 times, make a homework task that includes all requested topics, the post has to be covered all topics. Make sure the information available in your pot is not taken from other sources.
| In this course, we will be going to learn more about what is the Chart Patterns and will also learn few Chart Patterns which make us a successful technical analyst and it will also help us to identify the right time for an investment. |
Let's begin our 3rd class.
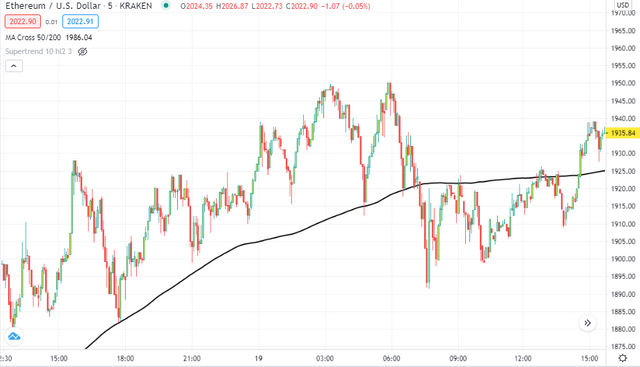
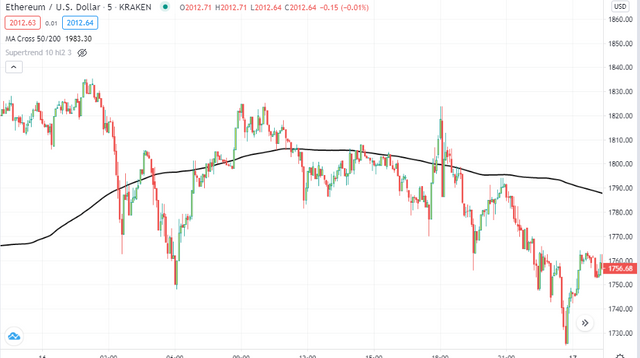
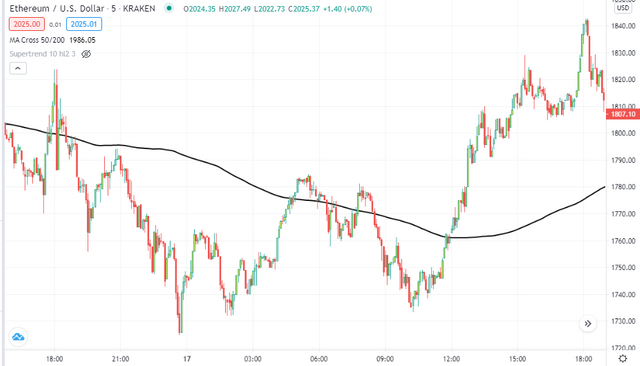

In the above images generally, we can say they are charts. However, while we are investing and trading they are actually price formations or you can say chart pattern for assets.
These patterns perform one of the most crucial roles in technical analysis to confirm the signals for buy or sell.
Such chart patterns can be found in any time frame of a candlestick chart(5 minutes, 15 minutes, 30 minutes, 1 day) and provide clear signals for entry and exit based on their Support and Resistance.
As we learn that the Support is the level from where assets price looks difficult to move below and Resistance is the level where assets price looks difficult to move above.
According to the Support and Resistance levels chart patterns provide a proper indication for entry and exit, price forecast, profit and stop level target.
In the technical chart and based on price breakout, there are mainly two types of patterns we see, Continuation patterns and reversal patterns.
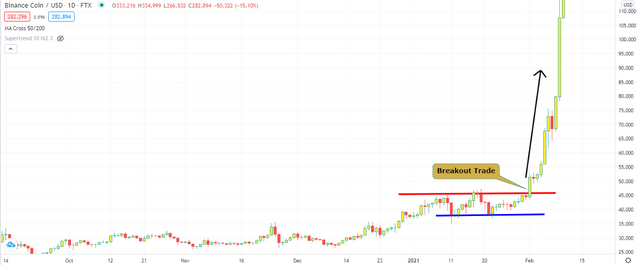
As we said, Support is the level from where assets price looks difficult to move below and Resistance is the level where assets price looks difficult to move above. Now, when any asset price tries to move above resistance or below the support, this movement of price called as Price Breakout.
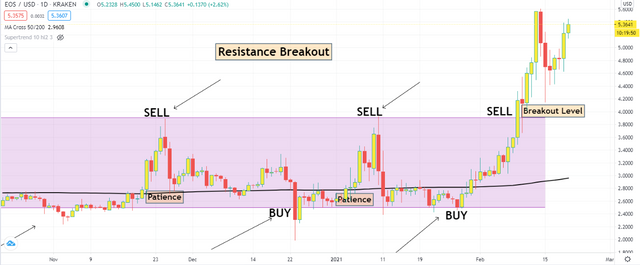
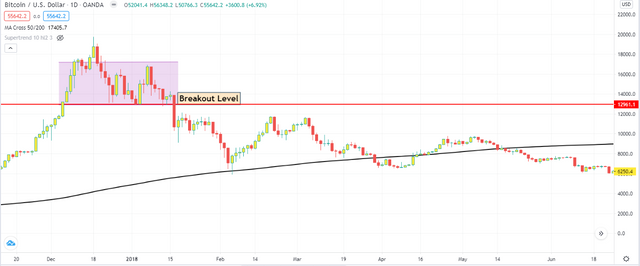
Entry Level: It is risky to Trading or Investment on the Price Breakout level, but it is also the quickest trade which gives a big profit in very little time.
Stop Level(STOPLOSS): Previous, second last Support Line. If you entered with a buy order at the breakout and later if the price comes down then you have to exit from the position when the price goes more down to the second last support.
In the continuation pattern, it indicates the major chances of the assets will continue in their existing trend, it could be either downtrend or uptrend. In this, the collection of the price or retracements done quickly within the same trend.
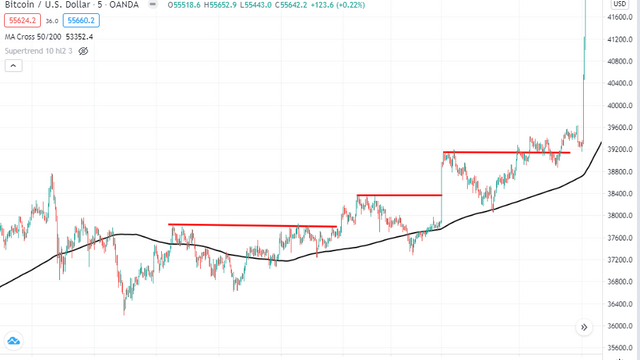
To identify the Continuation patterns on the Technical chart, Higher High and Lower Low is one of the patterns and can be seen on the technical chart in any time frame.
Higher High Pattern
In this, the buyers take command on the asset price more than sellers and take the price back to the recent high.
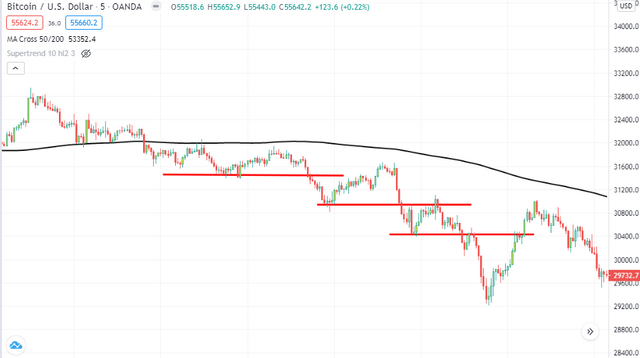
Lower Low Pattern
In this, the sellers take command on the asset price more than buyers and take the price back to the recent low.
When you find the support level and waiting for the asset price to come down at the support line, but then the asset price went up from the middle before the support level.
Here, you will see two low points but the second point is upside than the first point. Draw a Trend Line at this both low and let the trend line continue.
Based on the Trend Line, when asset price comes down and touches the Trend Line, we can go for Buy.
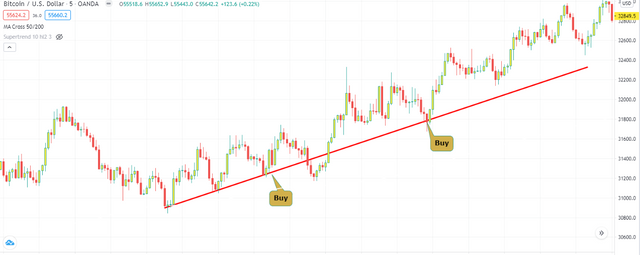
Similar to the above Higher High formation concept, the buyer can take their exit point and the seller can take their entry point in Lower Low formation.
NOTE 1: For safe trade make sure the first low point is close to the third low which is buying level, because price moving in an overbought, and when price movement breaks the trend line, then it can be possible that the market trend may get change.
NOTE 2: For buyers at the third low point, the Stop Level(STOPLOSS) will be the first low point.
NOTE 3: If you missed and the market already moved in a Higher High or Lower Low Formation, then you can choose any low/high as a first and according to that third low/high for entry, but first low/high will be Stop Level(STOPLOSS).
The basic concept about Reversal Patterns we have already learn in Support and Resistance. Now we will see in detail.
In Reversal Patterns, it indicates the major possibilities that the existing trend is come to the end and now the trend may go in the reverse direction.
Reversal Patterns provide signals quite early and indicate about the trend change with a small range of Stop levels (STOPLOSS). However, after the indication of Reversal Patterns, the trend not changed speedily or immediately and sometimes move in the range only.
Reversal Patterns can identify on the charts by Candlestick formation, one of the most usable formations which we called as Double Top and Double Bottom.
Top means a high point, and double top means two high points but at the same level. As we are mentioning the word High which means the reversal pattern indicates the start of the downside.
In this we see the price movement made a high point, then come down and again come to around the same last high point, here it looks like its struggling but not getting success, this indicates that the uptrend is reaching to the end and downtrend will start.
Those who brought the asset at the support level or in a higher high formation can take an exit when it was found that the Double Top pattern has created on the Chart.

Opposite to the Double Top, the Double Bottom formation is like, the price pullback in the downtrend and later come at around the same level, here it looks difficult to go down more which indicate that the reverse mode from the bottom is confirmed and the trend may go in the reverse from the bottom which means upside.
Those we wanted to enter into the asset can find this formation and once it confirmed they can enter at this level.
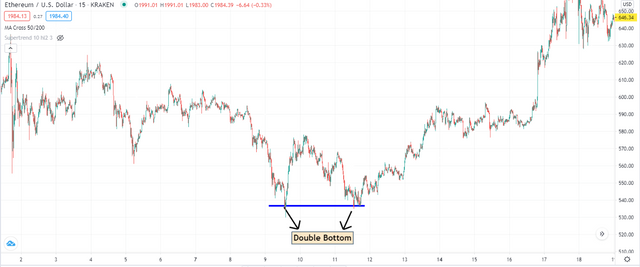
In the double bottom, you can see after confirmation at the second bottom the price started moving up and further, we can also see higher high formation which confirmed the trend reversal.
While investing or in Trading, we should have to work with the Stop Level(STOPLOSS). Stoploss is a type of order which you set to exit from a session to avoid more losses.
In crypto or any other market, nothing is defined, every day is a new day in a market. We may don't know what is happening at the backend, with the help of technical study we can see the entry and exit points, but the same chart also provides you Stop Level(STOPLOSS) point and if price cross or tuches the Stop level, then we should have to move from that trade and accept the small, don't wait more or else the loss will get increased.
The technical concept does not provide 100% accuracy but with proper study and a good level of patience, we can find entry and exit levels, this chart also provides us Stop Level(STOPLOSS) for incase if the market does not move according to the chart formation then how and where we can limit the loss.
With the help of Stoploss, you are giving a limit for the loss, and instead of increasing loss, it will good to exit with a small loss and move to the next assets, then find an entry point.
Stoploss can be found based on the Assets history where the previous support stands.
While Investing or Trading and placing a buy order, we have to check the Assets history and find previous support so that we can limit for our losses.
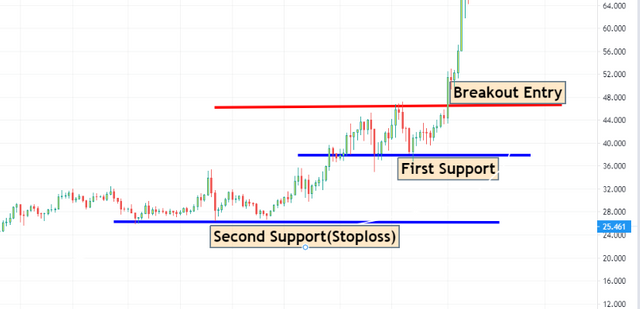
Ideally, there has to be 3 support and 3 resistance, but at least we have to find 2 supports based on assets history, and according to that we can go for buy order and limit for losses.
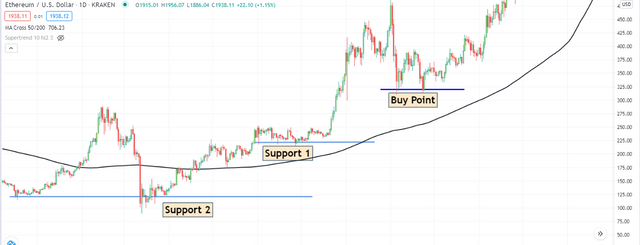
Let's zoom in on the same chart.
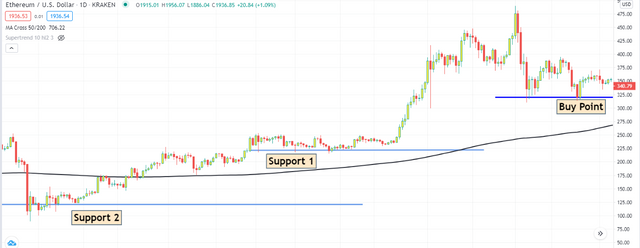
According to your pocket size you can decide the level for the stop loss. Mostly second or third support/resistance should be a Stop Level(STOPLOSS), for safe trade find third support/resistance which closes to the first support/resistance(entry point)
NOTE 1: Make a strict rule to work with a Stop Level(STOPLOSS) while Investing and Trading.
We will stop here. You may feel that now technical concept may going little difficult, but believe me, it is not difficult that much, you just need to see graphs and understand the market, once you understand the market well then only you can able to make a profit and the limit losses too.
If you have any concerns, doubts, questions on this topic, you can ask me in the comment section and I will try my best to address them.
If you like to give me any feedback then that also you can give it from the comment section and I will try to work on that for the next course.
Homework Task
The homework task will be based on this topic only hence make sure you understood this topic very well. I guess I have tried to explain in very simple language hence I don't think you need to refer to any other sources, copy-paste as you know PLAGIARISM isn't supported.
You just need to see graphs and explain it, simple.
NOTE: All images should be based on charts that you refer and images/candle charts should be taken on your own.
As we all are in Steemit Crypto Academy, so It will be great if you use screenshots for Cryptocurrency assets/coins.
The Title for your Homework Task will be " Steemit Crypto Academy | Homework Task 3 For @stream4u | What is Chart Patterns? | Price Breakout - Continuation Patterns - Reversal Patterns | STOPLOSS. "
Below are the Topics that need to be cover in this Homework Task Post.(All Topics are needed in a post)
- What Is A Chart Pattern? Explain with Candlestick Charts.
- What Is A Price Breakout? Explain with Candlestick Charts and mention the price levels.
- What Is A Continuation Pattern? Explain with Candlestick Charts and mention the price levels.
- What Is A Higher High Formation? (Explain with one of the crypto coin charts where the Higher High Formation identified.)
- What Is A Lower Low Formation? (Explain with one of the crypto coin charts where the Double Top Pattern identified.)
- What Is A Reversal Pattern?
- What Is A Double Top Pattern? Explain with one of the crypto coin charts where the Double Top Pattern identified.
- What Is A Double Bottom Pattern? (Explain with one of the crypto coin charts where the Double Bottom Pattern identified.)
- In Investing & Trading What Is The Importance of Stop Level(STOPLOSS)?
- Where To Find & How To Set A Stoploss?
- What Understood From This Course?/ Conclusion.
(You can use topic heading while making homework task post so that before publishing you will know if any missed.)
RULES
IMPORTANT:- All homework posts should be posted in the community Steemit Crypto Academy . and for Homework Task 3, add tag #cryptopattern, #stream4u-week3 in the first 2 tags. Also, tag @stream4u somewhere in a post.
PLAGIARISM Will Not Accepted, hence make sure content in the post not copied and pasted from certain sources.
Submit Homework Task Post from 22nd Feb 2021 To 28th Feb 2021.
Post Require a minimum of 300 words. Tips On minimum of 300 words!
All screenshots of the Candlestick Charts should be taken on your own.
The post which has all mentioned topics will be considered as Completed.
(For any concerns, doubts, questions on this homework task, you can ask me in the comment section below.)
Thank You.
@stream4u
Crypto Professors : Steemit Crypto Academy
This Post and My Comments are Set For 100% Power Up.
Hi @stream4u, my name is Albert, I'm from Venezuela and this is my first homework. I'm joining just now but previously I have read and studied the 2 first classes.
https://steemit.com/hive-108451/@allbert/steemit-crypto-academy-or-homework-task-3-for-stream4u-or-what-is-chart-patterns-or-price-breakout-continuation-patterns
This Post Shared On Twitter
Спасибо вам за потрясающий пост. Вы правы, прежде чем приступить к выполнению домашнего задания мне потребуется ещё раза два прочитать ваш пост. И это очень полезное задание. Я восхищена вашей способностью объяснять сложные вещи простым и доступным языком.
Thank you.
The topic may looks big, number of topics but if ask me then I will say these are simplest topic, just need to check graph and explain in post.
Да, я поняла ваш пост, спасибо. Я обязательно сделаю мою домашнюю работу. Мне нравится тема, она очень полезная.
Wonderful. Hope you are cool. 👍
thanks, @ckole
yeah it is also very nice way and easy to understand the all stage in which we can learn about trade,so i think sir ,candle stick chart guide us to make patience in trade and also focus on best time
candlestick chart actually tell us lot of things, we just need some details about concept to understand the language of candlestick chart. They tell us where to enter, where book profit, where set stoploss........sometime only because of greed we lost profit too when expecting more profit.
Patience is most valuable thing in investing and trading, those who understand candlestick chart the patience gets create automatically.
yes sir i agree , i will keep these words in my mind always
"Patience is most valuable thing in investing and trading, those who understand candlestick chart the patience gets create automatically"
You are back with another mind blowing homework and tutorial. I love this prof. This is an indept analysis, and I'm always willing to go deep. I will surely contribute my quota. Please, expect my post before the deadline. Thanks for the wonderful lecture. One love ❤️
Greetings friend, your explanation is fabulous and clearly understandable, thank you for your contribution to this community, greetings
This is quite an interesting lecture sir @stream4u, I wish to make my entry.
Thank you. Just check homework tasks before and after making a post to make sure nothing is left. I am waiting for your homework task post.
Alright Sir
Dear professor @stream4u. Thanks for the awesome lecture delivery. I've performed the task.
This is the task post here!
It can also be found through the link below;
https://steemit.com/hive-108451/@fredquantum/steemit-crypto-academy-or-homework-task-3-for-stream4u-or-what-is-chart-patterns-or-price-breakout-continuation-patterns
Thank you once again.
Hola profesor, acá presento mi tarea
https://steemit.com/hive-108451/@clavel/steemit-crypto-academy-or-course-3-by-stream4u-or-what-is-chart-patterns-or-price-breakout-continuation-patterns-reversal
Listo me falto la ultima letra disculpe
Saludos
The Post is not accessing, kindly recheck and update proper link.
Perdón me falto una letra.
https://steemit.com/hive-108451/@clavel/steemit-crypto-academy-or-course-3-by-stream4u-or-what-isLi-chart-patterns-or-price-breakout-continuation-patterns-reversal
You topic the wrist reading is one of my interesting topic to learn. I love your explanation because it is in simple language which is very much easy to understand by by the subcontinent people like me from Bangladesh. hopefully I shall participate with my homework this week