SEC S18-W5 || Mastering Trading with Stochastics and Parabolic SAR.

To get a better return from trading and investment it is must needed that your investment should execute at the right time. You get returns from trading, investment when an asset price moves up from the price point at which you have invested, so we need to predict assets future price movement to execute trade at the right time. Here, trading indicators Stochastic Oscillator and Parabolic SAR can be helpful to predict the assets future price which makes your investment better.
In this blog we will explore about trading indicators Stochastic Oscillator and Parabolic SAR which helps to improve trading strategies and trade decision making process. Understanding these indicators can give you insights of financial market.
Table of Contents.
- Explain the components of the Stochastic Oscillator. How does it help in identifying overbought and oversold conditions in the market?
- Describe the Parabolic SAR indicator and its application in identifying the trend direction. How is it interpreted differently in an uptrend compared to a downtrend?
- How can the combination of the Stochastic Oscillator and Parabolic SAR be used to create a robust trading strategy? Provide a detailed explanation.
- Using historical data, analyze a trading scenario for the STEEM/USDT pair where the Stochastic Oscillator indicated an oversold condition. How would you use this information along with the Parabolic SAR to make a trading decision?
- Perform a technical analysis on the current STEEM/USDT pair using both the Stochastic Oscillator and Parabolic SAR. Based on your analysis, what would be your trading recommendation?
Explain the components of the Stochastic Oscillator. How does it help in identifying overbought and oversold conditions in the market?
The trading indicator Stochastic Oscillator is well known for a momentum indicator which is helpful in trading to predict price direction, price trend reversal point. Stochastic Oscillator is helpful to locate the overbought level from where it is expected to price will go down and oversold level from where it is expected to price will go up.
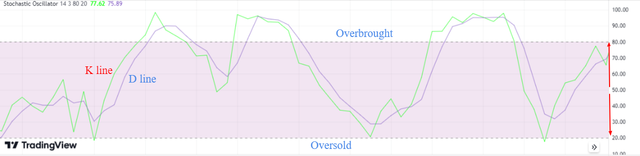
The components of the Stochastic Oscillator, it calculates range between 0 to 100 wherein the 80 is upper level and 20 is lower level. If the Stochastic Oscillator line is above 80 then it indicates the overbought zone and line below 20 then it indicates oversold zone.
Stochastic Oscillator look for the closing price of the asset over the set past duration, normally it set 14 as past duration. On a weekly chart, it will calculate as past 14 weeks, on daily chart it will be calculate as 14 days, and on hourly base chart it will be 14 hours.
Stochastic Oscillator drawn 2 lines K and D. Stochastic Oscillator price is called as K line wherein the 3 period simple moving average of K line is a D line.
How does Stochastic Oscillator help in identifying overbought and oversold conditions in the market?
- When the Stochastic Oscillator line is above the 80 level, it indicates the overbought condition in the market. At this condition is can be predicting a trend reversal. A sell signal is appeared when Stochastic Oscillator line crosses from above to the 80 level and goes below it. Check below chart example.
Note that to confirm the sell signal, look for a K like cross the D line from above to blow in an Overbought zone.
- When the Stochastic Oscillator line is below the 20 level, it indicates the oversold condition in the market. At this condition is can be predicting a trend reversal. A buy signal is appears when a Stochastic Oscillator line pass through its lower level means the 20 level and goes above it. Check below chart example.
Note that to confirm the buy signal, look for a K like cross the D line from below to above in Oversold zone.
Describe the Parabolic SAR indicator and its application in identifying the trend direction. How is it interpreted differently in an uptrend compared to a downtrend?
Parabolic SAR (Stop and Reverse) indicator is help to detect the current market, assets trend direction up or down. Parabolic SAR indicator also helps to identify the market, assets reversal point. Such information helps traders to understand when to enter and exit their trades.
Parabolic SAR indicator is also helpful to trail the stoploss that means, when Parabolic SAR appear, it helps trader to catch high profitable trades and to exit from the trade, it indicates reversal point from where the asset price may go opposite direction.
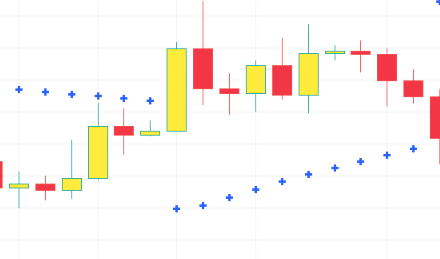
For graphical appearances, Parabolic SAR indicator draws the points/dots on the price chart above and below the candle. You can set appearance as per your choice like dots, + sign, line, bar. Like below.

Identifying the trend direction.
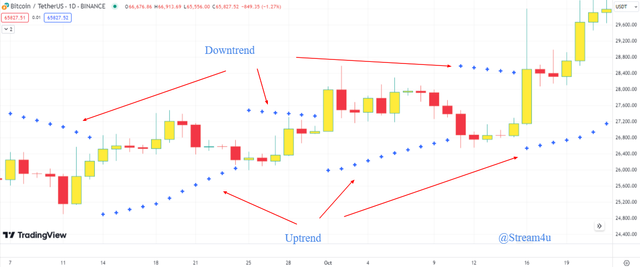
Identifying market, assets trend direction with using Parabolic SAR is pretty simple. Parabolic SAR draw a dot or any symbol that you selected below and above each candle to show the current market trend.
Identify Uptrend direction: Parabolic SAR starts placing a dot or any symbol that you selected below the candles.
Identify Downtrend direction: Parabolic SAR starts placing a dot or any symbol that you selected above the candles.
When a candle crosses the dots, the dots stats appearing opposite site indicating trend reversal point.
How Parabolic SAR interpreted differently in an uptrend compared to a downtrend?
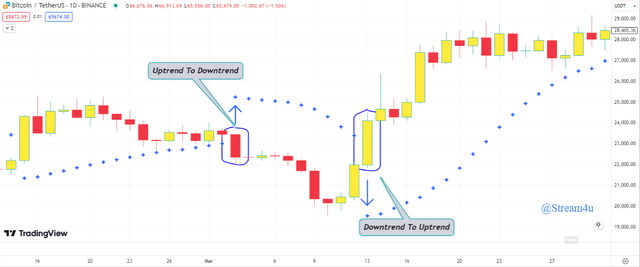
In downtrend, the Parabolic SAR starts generating dots above the candle. In this condition it is expected to continue price moving down, indicate the market is now in the bearish trend. In this phase when candle cross the level of dots, it indicates the trend reversal means trend is likely moving from downtrend to uptrend.
To trail the stop loss, the short traders can refer the dots in a downtrend and when price cross the dots the traders can adjust their stoploss levels to book the profits.
However, the Parabolic SAR view different in an uptrend. Here, Parabolic SAR starts generating dots below the candle. In this condition it is expected to continue price moving up, indicate the market is now in the bullish trend. When candle cross the level of dots, it indicates the trend reversal means trend is likely moving from uptrend to downtrend.
To trail the stop loss, the long position traders or holders can refer the dots in a uptrend and when price cross the dots the traders can adjust their stoploss levels to book the profits.
How can the combination of the Stochastic Oscillator and Parabolic SAR be used to create a robust trading strategy? Detailed explanation.
Combining Stochastic Oscillator and Parabolic SAR indicator can used to create robust trading strategy by utilizing these individual indicator specialties like Stochastic Oscillator used as momentum indicator and Parabolic SAR used for a trend indicator.
To create trading strategy from combining Stochastic Oscillator and Parabolic SAR indicator, we will use Parabolic SAR indicator to detect the trend and to confirm that trend we will use Stochastic Oscillator indicator. Additionally, in this strategy, to confirm the trend, we will look for the 50 level of Stochastic Oscillator indicator along with the level 80 as overbought and level 20 as oversold. Stochastic Oscillator line from 20 to 50 consider as bullish and 80 to 50 consider as bearish.
Trading strategy
Parabolic SAR to detect the current trend. If Parabolic SAR is below candling the it will be up trend and above the candle then it will be downtrend.
Now, to confirm the uptrend with the Stochastic Oscillator, D line is below the K line and it is moving from 20 level to mid level 50. To confirm the downtrend with the Stochastic Oscillator, the K line should be below the D line and moving from upper level 80 towards the mid-level 50.
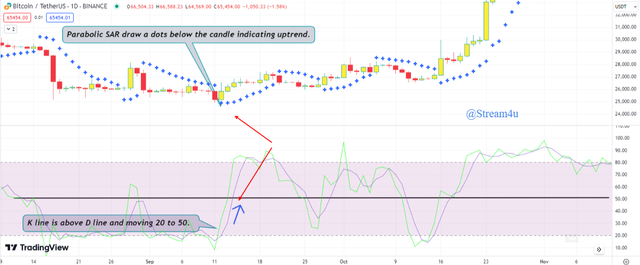
- Buy Signal - K line cross the D line around Oversold level means 20 level and moving to the 50 level, during this time the Parabolic SAR draw a dot below the candle indicating uptrend. Check below example. 50 level shown with black line.
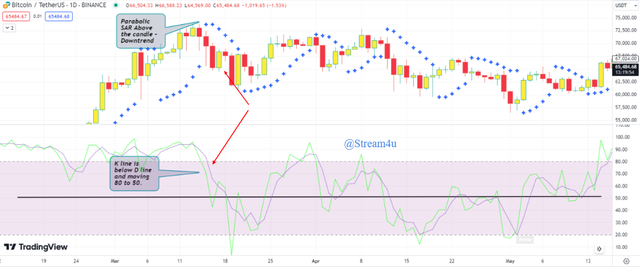
- Sell Signal: K line cross the D line around Overbought level means 80 level and moving to the 50 level, during this time the Parabolic SAR draw a dot above the candle indicating downtrend. Check below example. 50 level shown with black line.
- Stop Loss: The stop loss can be set previous swing level below the buy level.
Using historical data, analyze a trading scenario for the STEEM/USDT pair where the Stochastic Oscillator indicated an oversold condition. How would you use this information along with the Parabolic SAR to make a trading decision.
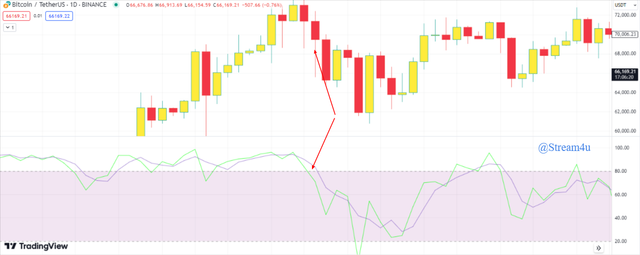
We will analyze the STEEM/USDT pair between June 10 2023 to June 18 2023 when it was below 20 level of Stochastic Oscillator means in oversold condition. Please check below technical chart.
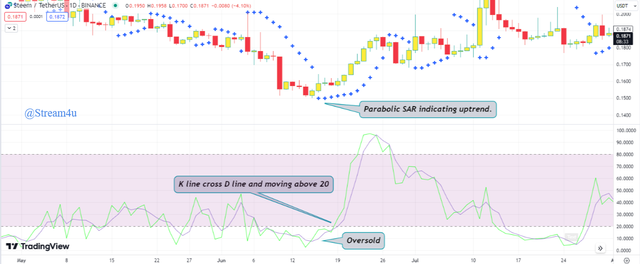
In the above technical chart, we can see the Stochastic Oscillator indicator was showing STEEM/USDT pair at the oversold condition means below 20 level on June 10 2023. Now with Parabolic SAR indicator we can make the below possible trading decision.
The situation with Stochastic Oscillator and Parabolic SAR indicator is like STEEM/USDT pair is below 20 level of Stochastic Oscillator means in oversold and Parabolic SAR dots are showing above the candle means downtrend.
We will wait till the Stochastic Oscillator K line cross the D line and both crossing to 20 level from below to up and Parabolic SAR dots are showing below the candle.
On 15 June 2023, we find Stochastic Oscillator K line cross the D line at 20 level (indicating uptrend) but both still below the 20 level. However, the Parabolic SAR dots are still showing above the candle means in downtrend. Now to confirm the potential buying opportunity in STEEM/USDT pair, we will wait till the Stochastic Oscillator K line and D line cross 20 level and moving to 50 level and Parabolic SAR dot appear below the candle.
on 16 June 2023, we find Parabolic SAR dots start showing below the candle means indicating uptrend. However, still Stochastic Oscillator K line and D line are below the 20-level means in oversold condition.
Till 18 June 2023, we can see Parabolic SAR dots showing below the candle means still it is indicating uptrend. But Stochastic Oscillator K line and D line are below the 20-level means in oversold condition. For buying opportunity we need to confirm the trend which is possible when Stochastic Oscillator K line and D line cross 20 level and moving to 50 level.
On 19 and 20 June 2023, we got buying signal as we can see Parabolic SAR dots still showing below the candle means still it is indicating uptrend. Additionally, the stochastic oscillator's K and D lines both crossed the lower 20 level and moved towards the mid-level 50. Here, uptrend is confirming means buy signal is generated at 0.15 USDT
The stoploss will be previous swing level which was at 0.13 USDT.
Perform a technical analysis on the current STEEM/USDT pair using both the Stochastic Oscillator and Parabolic SAR. Based on your analysis, what would be your trading recommendation?
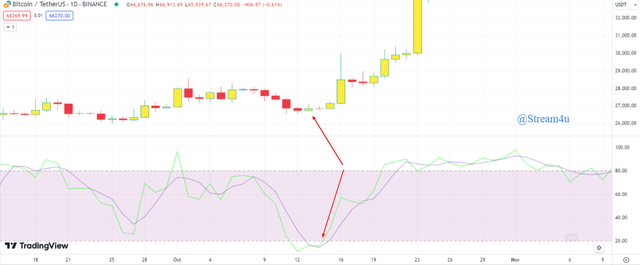
As of today 19th June 2024, the STEEM/USDT pair trading at 0.18. Please see the below current technical chart for STEEM/USDT pair and trading recommendation based on analysis as per Stochastic Oscillator and Parabolic SAR indicators.
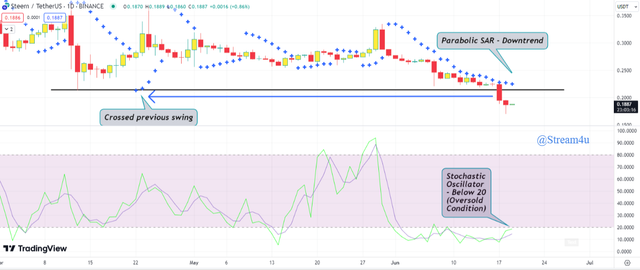
Analysis.
- The Parabolic SAR indicator dots are currently creating above the candle means indicating downtrend.
- The Parabolic SAR indicator dots has broken the previous swing means it has given breakout at its support level (shown by arrow). Indicating downtrend.
- Stochastic Oscillator indicator K line has just crossed D line but both are below 20 level means in oversold zone, downtrend.
- Stochastic Oscillator indicator K line is about to cross 20 level from below.
Trading Recommendation.
- Parabolic SAR indicator the dots are above the candle but due to it has break its support level hence now there is a big gap made between the candle and the dots.
- Possible movement. For candle to cross the Parabolic SAR dots, it needs to move big upside so that as mention above point about gap, it will get field. So, it is possible that big movement at the upside will be see. However, this will not confirm the uptrend. It can be like fakeout. So, if this is happened the recommendation is to wait and have a patience. Verify that the market trend is confirmed by Stochastic Oscillator indicator.
- Wait till the Parabolic SAR indicator start generate a dot sign below the candle, then when it continues creating a dot sign below the candle, look at the Stochastic Oscillator. If Stochastic Oscillator K line and D line cross the 20 level and moving towards the 50 level, an uptrend can be confirmed and buying potential is possible at that level.
- Due to heavy oversold happened in last few days, a big reverse rally is a possible movement.
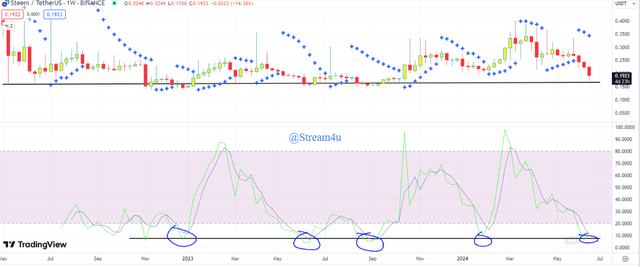
- Additionally, if you look at the chart on weekly basis, you will see a clear support at the current level and as per the history a buying can be possible at this level so price can move up. Please see below weekly chart of STEEM/USDT pair.
Conclusion on Stochastic Oscillator and Parabolic SAR Indicators.
Using multiple indicators can help traders and investor to create robust strategies. But it should test and check their success rate before implementing on trading decision. Based on majority signals means when multiple indicators indicate market trend at the same direction, it can help for traders and investors to understand market movements.
Combining Stochastic Oscillator and Parabolic SAR indicator can help for traders to take trading decision as Parabolic SAR indicator can show the market trend and Stochastic Oscillator can indicate the momentum in a market. However, the traders should have to take decision when trend confirm by both indicator and with strict stoploss.
Disclaimer: The information provided in this blog is for educational and informational purposes only. It should not be construed as investment advice or a recommendation to buy or sell any securities mentioned. Investing in the stock and crypto market involves risks, including the potential loss of principal. Readers are encouraged to conduct their own research and consult with a qualified financial advisor before making any investment decisions. The author of this blog is not liable for any losses or damages arising from the use of the information provided herein.
Author,
@steam4u
If you like this blog, you can join me in the comment section of this blog.
I really like this topic, between the bullish and bearish phases both can be seen at a certain level (20/80), and if both of them cross the line then that's when the market trend will usually reverse...
And also during a trend reversal, this can also be seen from the graph displayed which is different from the market graph that is currently moving....
Having an indicator like this should make it easier for traders to analyze market movements and will really help us to minimize losses...
Wish you luck sir in this theme, you made it clear...
👍👍👍
Thank you for your kind words. I am glad that you like this topic. Agreed that having such indicator can help traders easier to analyze the market and minimize losses, and for this they have to follow strict rules and trade with stoploss.
Congratulations, your comment has been successfully curated by our team via @steemdoctor1 at 5%
Upvoted! Thank you for supporting witness @jswit.
On Twitter X - SEC S18-W5 || Mastering Trading with Stochastics and Parabolic SAR.
Upvoted. Thank You for sending some of your rewards to @null. It will make Steem stronger.
TEAM 7
Congratulations! Your post has been upvoted through steemcurator09.Hello my dear friend you wrote awesome. Both indicators work almost equally when to exit the market and when to enter the market. Two indicators are actually very important for a trader. Best of luck to you.
Thank you for your kind words. Your observation is right they almost work equally .
🤝