SEC S18-W1 || Mastering the Markets with technical analysis
What is the importance of technical knowledge in trading? Describe the key components and information you can gather from a technical chart.
Explain how to read candlestick charts and the significance of different time frames in trading.
Define chart patterns and differentiate between continuation patterns and reversal patterns. How can chart patterns be utilized to set effective stop-loss orders?
What is Trading View and how can it be used to apply technical indicators in real-time trading? Describe the relationship between support and resistance levels and how technical indicators can aid in understanding these concepts.
Provide an overview of pivot points and discuss their calculation and significance in trading. Explain how to configure and trade with pivot points, including strategies for pivot point reverse trading.

Hey dear friend you made a nice decision to go through my article I must say to you you will not regret your actions this is because the knowledge in which you get here for free you're going to be able to get it for free or at a cheaper cost anywhere else so I suggest you to take your time to go through the article, truthly speaking I'll be open to any questions, any opinions or suggestions. Before I continue I want to thank the professors who made this possible for us to have access to quality contest topics I really appreciate their good job and creativity.

What is the importance of technical knowledge in trading? Describe the key components and information you can gather from a technical chart. |
|---|
Technical knowledge when it comes to crypto trading is of high necessity this is because going to trading without technical knowledge it just like a farmer who goes to the farm without his farming tools like holes cutlass or any sort of machinery that could help do the farming activities has he likes.
Having technical knowledge in the act of trading wether crypto or stock exchanges is what makes the difference between traders and gamblers, this is because without such technical knowledge you would end up placing trades based on assumptions of personal beliefs or predictions which is really bad and a very dangerous way of trading. This is because with such mentality and psychology you would easily run on loss while trading on cryptocurrency or stock exchange or even the fiat market.
If you are used to old sayings you would have heard the word that says "knowledge is power" and I said truly to you my friends technical knowledge is power of a perfect or excellent trader. This knowledge are essential in predicting price movement of asset at every period of time to avoid unnecessary loss of asset that could be saved with the help of technical analysis why trading your different asset most especially crypto assets.
In my own understanding technique analysis is the use of technical skills like technical indicators technical strategies and even Japanese candlesticks to help analyze and predict the price movement or trends at every period of time to help maximize one profit while trading at any market. With this definition it is obvious that trading without technical analysis is a very risky step to make, if you want to save your asset.

All thanks to technical analysis tools, my trading score is quite awesome 😎 this week. So why would you avoid using technical analysis tools.
Basically there are three types of technical analysis tools or strategies that could be used to help improve the profit of a trader while trading,
✅ Japanese Candlestick
✅ Technical Indicators
✅ Trendlines
Japanese candlesticks are very popular and effective technical tool in technical analysis for predicting and understanding price movements and trends at every period of time. The Japanese candlesticks are very powerful and important tools because it good in predict of asset price movement at any period of time
Structure of a Japanese Candlesticks
Every single candlestick gives traders a visual representation of the current price movements within a specific time zone like month, day, hour, or even minute, every of this candlestick consists both body's and wicks.
Body:
This is the body which act that accurately represents the price range between the opening and closing prices of an asset, If the closing price is higher than the opening price, the body is typically filled or colored green, meaning bullish movement. Otherwise, if the closing price is lower than the opening price, the body is colored red, which means a bearish trend.
Wicks (Shadows):
This are also very important lines extending above and below the body, the contain important information on who is in control of the market at every period of time. Also it means the highest and lowest prices reached during the time period of the price movement. The upper wick indicates the bullish, and the lower wick indicates the bearish traders movement.
Ways to Use the Japanese Candlesticks
This candlesticks are usually formed in different shapes and these different shapes or format give traders different technique information that could give them an advantage and extra edge to profit from their trades at every period of time:
Doji:
A candlestick where the opening and closing prices are virtually equal, and the body I usually off very little size. That is to say they size of every wick is bigger than the body. It means indecision in the market, that is to say the traders the traders currently leading the market are having a re-think, which causes indecisive actions. As a result of this indecisive this candlestick most times shows that there are high chances of a trend reversals, that is to say if they market was on a bearish trend this candlestick shows that there is high chance of seeing a bullish trend very soon.
Hammer and Hanging Man:
Both have small bodies with long lower wicks, just like the famous hammers, the only difference between these two is that one looks like a hammer with it's head down and the other looks like a hammer with it's head up, A hammer found at the bottom of a downtrend, signals a potential bullish reversal. A hammer found at the top bullish trend or found at the top of an uptrend, signals a potential bearish reversal.
Engulfing Patterns:
A bullish engulfing pattern occurs when a small bearish candlestick is immediately followed by a large bullish candlestick that completely engulfs or cover the size the body of the previous one, that is to say an engulfing candlestick is seen when there is a small red body is followed by a big green Candlestick which something is 2x bigger.
While a bearish engulfing candlestick occurs when a small bullish candlestick is immediately followed by a large bearish candlestick that completely engulfs or cover the size the body of the previous one, that is to say an engulfing candlestick is seen when there is a small green body is followed by a big red Candlestick which sometimes it's is 2x bigger.

After some hours almost hitting take profit 😄

Morning Star and Evening Star:
The morning star is a showcases a bullish reversal pattern, it's discovered by three candlesticks. Starting from a long Red bearish candlestick, a green short-bodied candlestick, and a long green or bullish candlestick. While the evening star is identified by three candlesticks too. Starting from a long bullish candlestick, a reddish short-bodied candlestick, and a long Red or bearish candlestick.
Technical indicators are quantitative technical analysis tools that uses special mathematical calculations based on the market data like price of assets, volume of assets, or open interest of a security in the market. They are very important set of tools in technical analysis, this is because it helps traders predict future price movements and make smarter decisions. Below are types of indicators and their examples.
Types of Indicators
Technical indicators are usually classified base on their functions and the type of data they predict. That is to say each types of indicator are classified based on what data they focus on and the strategy the imploy.
. Trend Based Indicators
As the name implies the trend indicators helps to identify the direction and strength of a market trend, it tell the trader the type of market they are currently experiencing and where to expect the next trend reversal. When I say trend I mean the price movement either bullish or bearish at every period of time, although the price of an asset sometimes move in a sideway motion which is usually not bullish or bearish and what strangers advised strongly to avoid trading in this type of market.
Below are examples of Indicators that matches the description:
• Moving Averages (MA)
- Simple Moving Average (SMA)
- Exponential Moving Average (EMA).
• Moving Average Convergence Divergence (MACD)
•Average Directional Index (ADX)
Momentum Based Indicators
As the name implies, Momentum based indicators calculate the speed or rate of price movement to identify overbought or oversold conditions in the market. It also how fast a trend can change while trading. Types and examples are are listed below
•Relative Strength Index (RSI)
•Stochastic Oscillator,
•Commodity Channel Index (CCI)
Volatility Indicators
Also as the name implies the Volatility indicators measure the volatility rate at which the price of a makes changes at every period of time, they can also show when they market is over bought and when the asset are oversold. Types and examples are listed below
• Bollinger Bands
• Average True Range (ATR)
Finally the last on my list is trendline, trendline as the name implies trend lines, gather a lot of data and informations from previously seen trends, the help traders know if the market is about to repeat itself or it's about to change or reverse a trend. This set of technique how to do with a lot of support line and resistance line, which help support the price of an asset and also find the resistance line of an asset that when broken could generate a new high high or new low low. This set of ideas and knowledge are very important because it also helps trader find high quality stop loss and take profit while placing their trade.
•Diagonal trendlines
•Sideways trend
•Bullish trend
•Bearish trend
.jpeg)
These different trading trend lines are very efficient in the analysis and prediction of prize movement, in most cases traders uses this trend lines to form strategies or trading patterns that could help them quickly trigger or find a trading signal that could generate profit at a short period of time.
Explain how to read candlestick charts and the significance of different time frames in trading. |
|---|
Japanese candlesticks are very awesome trading analysis tools that helps check the price movement of an asset at every period of time this tools can help calculate which type of traders are in control of the market through their wick and the body. A lot of traders make use of this trading technique to analyze efficiently the price movement of an asset and generate maximum profit over a short period of time.
Although I have spoken on the types of candlesticks that are more efficient to me above I will still make some in-depth explanation on them with some practical use to show you and prove to you that they are really important and they could make you generate maximum profit just as I told me profit while trading.

From my trading app
Also I feel it's nice to tell you that the Japanese candlestick of an asset might varies in different types zones, that is to say they candlestick of an asset like Steem might be moving bullish in a 1 hour time zone and at the same time could bearish in a 4-hour time zone.
Also it's important to let you know that it would be wise to question your candlesticks in different time zones before diving into or placing a trade under asset, for example if I want to please a trade on an asset, I usually prefer the 4 hour time zone but before we fully believe my 4 hour time zone I could check the 1 hour time zone and if 15 minutes time zone. This is to tell me the right time to jump into my trading.
If my 4 hour time zone is showing me that there is an upcoming bullish trend then I do check on my 1 hour time zone to confirm if they are also giving similar signals. This is because although my 4 hour time zone is right that an upcoming bullish trend in the next 4 hours might occur but they might still be a little bearish trend in the rest 15 minutes or 1 hour, which could give you affect the profits you would have generated.

From the image above it's obvious that using candlesticks to predict price movement is quite easy, this is because all you have to do is check your chart for candlestick movement that is similar and to the one listed above or any symbolic data type. In the chatterbox I looked for a morning Star candlestick and luckily for me I found one an as you can see is lead to an awesome bullish trend.

Also from the above chat we go see how they doji candlestick commonly called dragonfly helped cause price reverse from a bearish trend to a bullish trend.

Above is a 1 hour chart for ethereum, with three technical Indicators namely Bollinger Bands, RSI and KDJ indicator. The Bollinger band is currently showing ethereum is experiencing an overbought, so therefore causing a new bearish trend. Also my KDJ purple line is also moving downward, which is also giving me a bearish signal and finally my RSI yellow line is also showing me a Bearish signal.
From my observations ethereum would experience a bearish movement but it should be noted that the volatility is going to be low because our top band and low band are not far from each other.
In summary the benefits of different time zone is to help traders get a clearer view of how they price movement of the asset is going to move, that is to say cross checking an asset in different time zone would help you give or get a very accurate price movements at a very accurate time it helps reduce indecisiveness in traders mindset while placing a trade.
Define chart patterns and differentiate between continuation patterns and reversal patterns. How can chart patterns be utilized to set effective stop-loss orders? |
|---|
Just as we have different technical indicators they are also so many types of trading patterns used by different traders to easily analyze and predict the price movement of assets of every period of time. Among the list of all these famous patterns used for trading continual pattern and reversal pattern is one of the most famous are most implemented trading technique because of it success in previous years.
As the name implies continuation pattern has to do with it when a pattern or a trading trend continue after a break, instead of the trend to divert or move in a different direction, the trade continuous in his previous trend after the small break. For example if Bitcoin price movement starts going up in a bullish format but all of a sudden two bearish candle sticks appears. Instead of the bully trend to stop and start going bearish because of the two bearish candlesticks the bullish trend resumes after the two bearish candlesticks and continue moving bullish in an awesome format.
Below are examples of continuation patterns
Rectangle patterns
As the name implies this types of continuation pattern and known for their rectangular shape, ask you to say the shape formed from the support line and the resistant level are usually in a rectangular format and that was how the name rectangular pattern was derived derived. This type of pattern occurs when the price hits the support line and they were exist all line more than once before breaking out to continue the previous trend.

Triangle continuation patterns
As the name implies this types of continuation pattern and known for their triangular shape, this is because the shape formed from the support line and the resistant level are usually in a triangular format and that was how the name rectangular pattern was derived . This type of pattern occurs when the price hits the support line and they were exist all line more than once before breaking out to continue the previous trend.
Wedge patterns
A wedge pattern is another special technical analysis chart pattern known as a converging trendlines that moves either uptrend or downtrend, which usually shows or predict a continuation an existing market trend. Just like other patterns there are two types of wedge patterns:
Rising Wedge:
This is usually formed by the higher highs and higher lows, of an asset forming into an upward-sloping wedge. It generally identify a potential bearish continuation.
Falling Wedge:
Formed by some lower highs and lower lows on the candlestick, shown as a downward-sloping wedge. It typically indicates a potential bullish continuation.

In the other hand they reversal pattern is self-explanatory that is to say, it is the opposite of the continuation pattern, this is because if an asset trend in a particular format at the particular period of time there's high chances that this trend would reverse back to the opposite trend after some little break.
Also may looking at my chat it's obvious that I would place a stop loss just below my support levels this is because I expect the asset not to break the support line but instead keep going bullishly
For example if ethereum start moving bullish then all of a sudden a little break comes in and cause a bearish reversal which will lead ethereum into a bearish trend, this type of market trend is known as a reversal pattern and such movement could be used to analyze and make profit from the market
Below are examples of reversal patterns
Wedge patterns
Head and shoulders pattern
Double top pattern
Double bottom pattern
I have spoken about wedges, so I would be talking about head and shoulders technique.
The head and shoulders pattern is another important and reliable reversal pattern technical analysis that signals a potential reversal in the trend of any asset . It consists of three top peak which are the central peak representing the head by the both sides there are two smaller highs which represents the shoulder. This reversal pattern works on any trend most especially uptrend and downtrend.

Looking at the chat it's obvious that they floki/usdt candlesticks which have recently touch my Resistance line is going back to test the support line, which I expect would break the support line to create a reversal trend (taking the asset Bearish). With this chat I'll be waiting for the asset to break my support line before I go and place a trade which definitely would be a sell order.
Note: it also has a neckline which is gotten when we connect the low peaks known as shoulders , in other words the necklines acts as a link between the three peak
In Summary the head and shoulders pattern helps indicates that the current trend of the market is weakening and a reversal to a is expected at any close period of time
What is Trading View and how can it be used to apply technical indicators in real-time trading? Describe the relationship between support and resistance levels and how technical indicators can aid in understanding these concepts. |
|---|
Trading view as the name implies is a very important and equipped tool that's why I can use it to easily access the market. It's an efficient chart platform that permit users to easily analyze different assets whether crypto stock or even index. From observation it is one of the most famous platforms that people use or would I say traders used to implement analyze and calculate the price movement of assets at a particular period of time.
Because of it fully equipped nature and it's awesome user interface most traders or market analyzers prefers using this platform to comfortably efficiently and effectively analyze movement of different sort of assets. The platform is accessed through different sort of devices whether laptops, desktop, Android phones, iPhones or even iPads.
Unlike most trading platforms that are of same class and level, the tradingview offers users who have lower source of income to access a free to use package on the tradingview, although they are activities and tools the could access a quite limited when compared to that of premium users who paid to get access to the site.

Step 1:
Go to Play store or any application you use to download application into your device and search for trading view, this application is present and is compatible with most devices

Step 2
Open the application after successfully downloading the application from a valid source to avoid unnecessary cyber treats

Step 3:
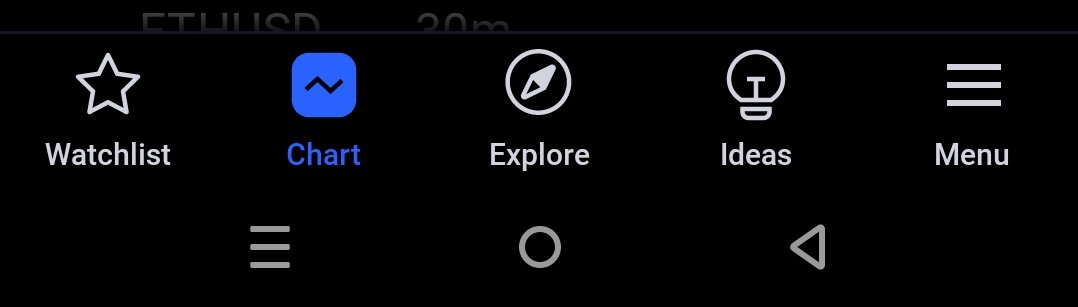
On the bar below 👇🏼, you would see that chart function. Click on chart to be directed to the chartish side of the platform.
Step 4
you would choose the asset you want to work with and a nice time frame just below the chat


Step 5:
Click on the linked image as seen in the image below to easily access the indicators, then the list of functions but you will click "indicator" to be redirected to another page


Step 6:
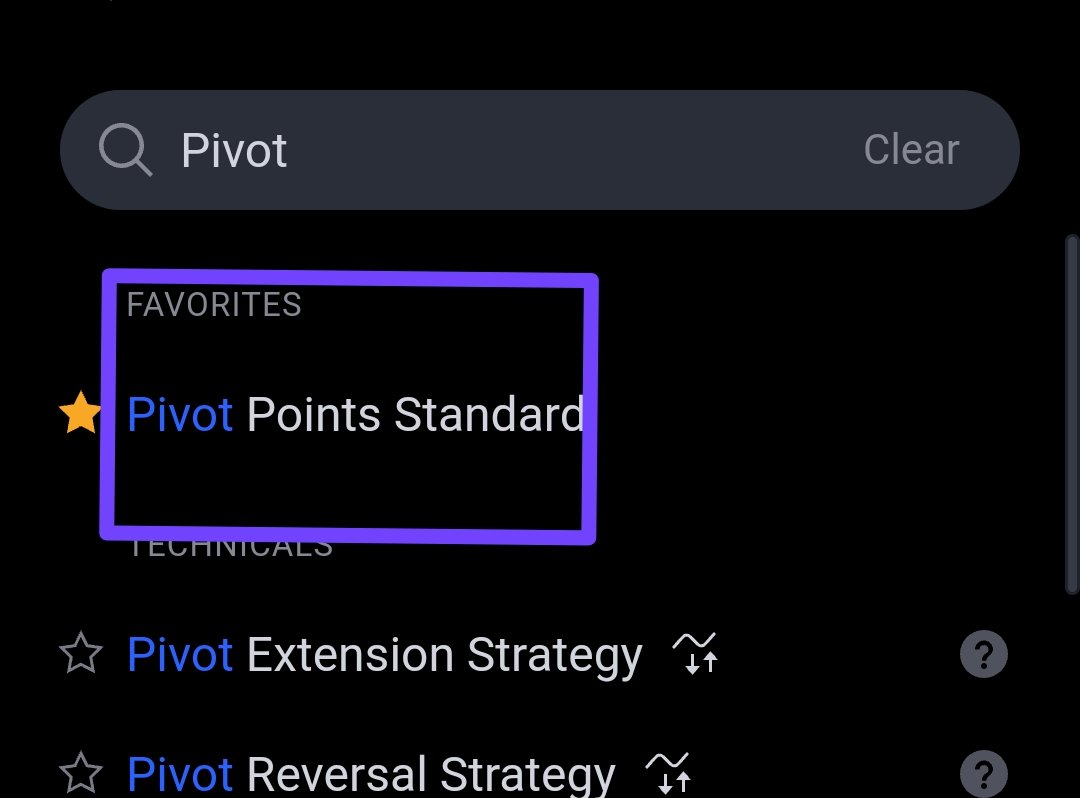
A page with a search bar would appear to you, for Swift action just typing the name of a indicator you want to use and search for it. When the search result is out all you have to do is just click on it and it would appear on your chart.
Or in some case like my own you click on the favorite function shown on the page it will list out all your favorite indicators so you can just implement them by just clicking on it once


Step 7:
In this step the output is seen where an indicator is seen on the chart for easy use and price predictions.

Support line and resistant line are very important tools that helps traders easily predict implement, quality stop loss and take profit sign at every period of time, this might look like that mare lines but I said to you this lines are very powerful because they could also use to discover and find out a new breakout and a reverse in trend at a very important period of time.
The support line as the name replies is a line that helps support the price movement of an asset at a particular period of time, he gives the price movement a support because whenever and asset it is this line in most cases that's a bounce back and faces a little reversal. Although this line could also be broken and whenever it spoken it is say that a new has been born, this usually leads to going back to past low lows.
On the other hand they resistant line is also very important because whenever a price movement hit the support line it keeps going until you meet a resistance line that either pushes back the price towards the support line or permit the price movement to break Free from the resistance line and generate new trend at a very valid point in time.
To implement this tool is easy on trading view, the steps are below
Step 1:
Click on the link which is in a image format below are seen in the picture below, is who direct you I permit you to draw lines as you wish based on the setting you prefers...

Step 2:
The output is shown on the chart below and I believe you will enjoy and understand it fully without any destructions or confusions.

Provide an overview of pivot points and discuss their calculation and significance in trading. Explain how to configure and trade with pivot points, including strategies for pivot point reverse trading. |
|---|
Pivot points are a very famous trading tools in technical analysis, there are used to determine help traders find potential support line and resistance line's while analyzing the chart. As the name pivot implies there are usually shaped like a pivot because there are firmed from data gotten from the high, low, and closing prices of an asset at the previous trading period (day, week, or month). Pivot points are very useful in helping traders predict the price movements of asset and help traders make smarter and highly informed trading decisions.
How we calculate of Pivot Points
Primary Pivot Point = P,
Support=S
Resistance=R
P = High+Low+Close/3
First Level Support (S1):
S1 = 2P−High
First Level Resistance (R1):
R1 = 2P−Low
Second Level Support (S2):
R2=P-(High−Low)
Second Level Resistance (R2):
R2=P+(High−Low)
Use of pivot in Trading
Determining Market Sentiment:
The pivot point technical analysis tools itself functions as an indicator of general market sentiment, that's is to say when the price movement goes above the pivot point, it is considered bullish trend, while when it is below, the pivot it is considered bearish trend
Identifying Key Levels:
It is a very important to the health identify key points or levels in the market chart, that's it to say it could help you generate profitable take profit signals and stop loss signals from it support line and resistance level that it produce for traders to easily monitor the market movement. If you look at this pivot point technical to you will see that you draws line and gives them Mark's and naming to help trailers differentiate between a support line and a resistant line
Find Breakouts and Reversals:
With the help of this support level lines and resistance level lines traders could easily find breakout or train reversal to help them maximize profit from every trade they make at every period of time. Because of the nature of this technical to it makes it easier and faster to find this support level and resistance level on the chat
Can be combined to other Trading Strategies:
Just like other trading strategies and technique is advisable that pivot point trading indicator or strategy that should be used with other trading technologies or indicators that could help maximize profit at a very faster rate.
Step 1.
It's obvious you already have a tradingview application at this time and you know how to access the chat function of the application, so when you get to the chat function you click on the button to find indicators as I have thought before. Just that this time around he will be looking for "pivot point standard"
Step 2
Click on the setting feature above, close to the indicator and you would be redirected to a new page, where you can set your pivot point technical analysis tool.

Step 3:
There are different settings made by different traders but on a picture below, you will see my prefect setting because of my device screen size if you have a bigger device you could use more S and R line.


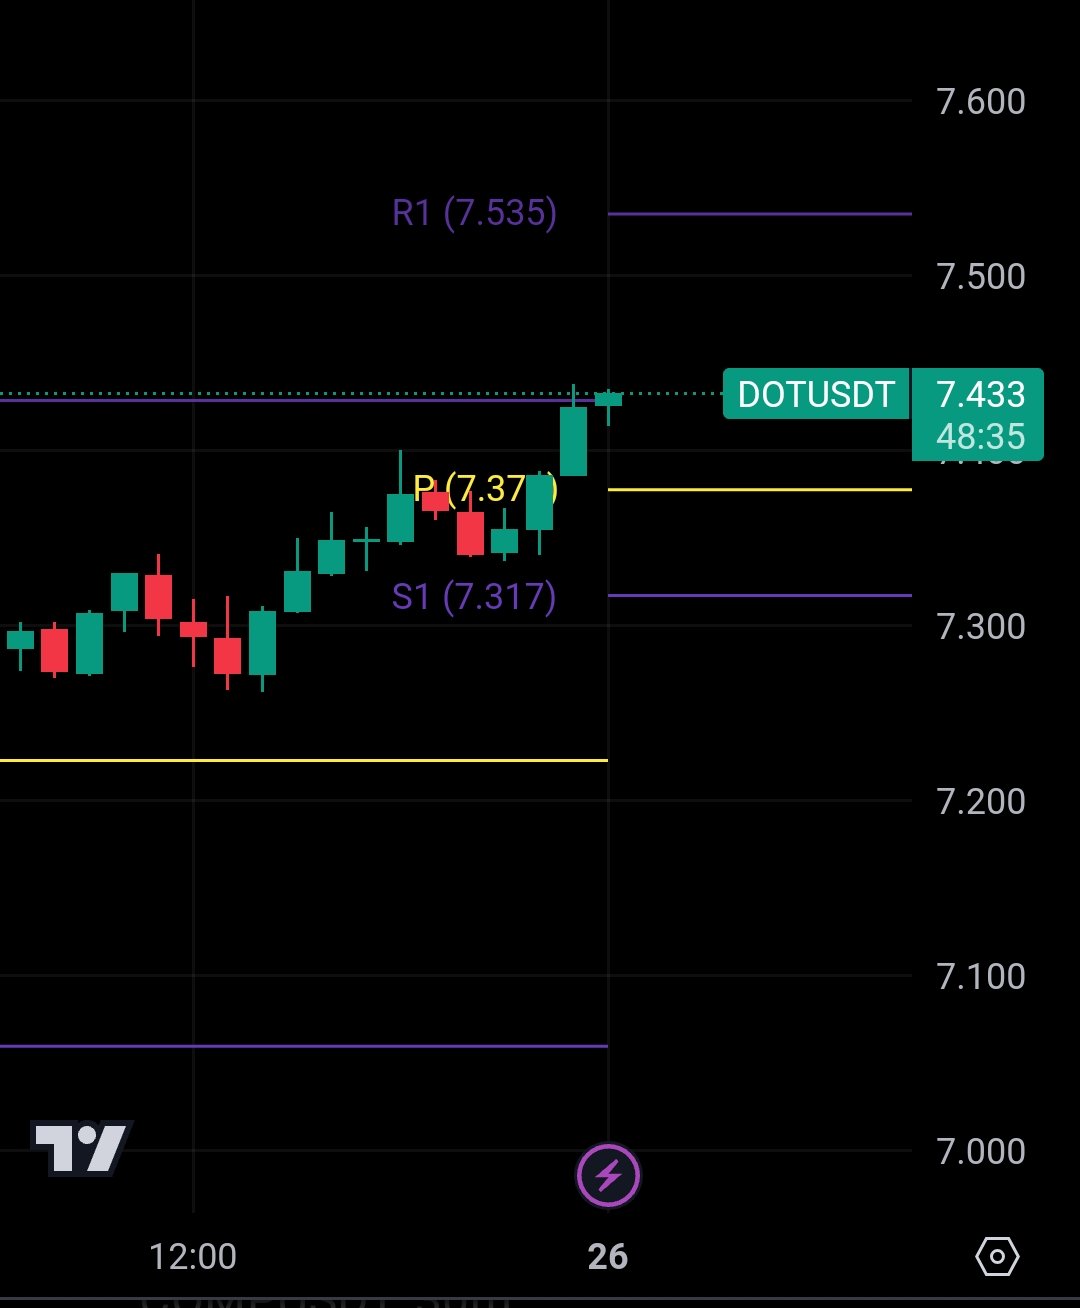
The image below you will see the output of the setting I made and I didn't just stop there I used it the technical indicator to predict the price of an asset. I use the p line as my entry point then I look for a thick profit close to the resistance line and a stop loss close to the support line. All thanks to the strategy I made a 9% profit in a short period of time.

in conclusion |
|---|
In conclusion I will say the professor did really well by actually keeping me very engaged in the act of searching for more knowledge in order to feed my entry and make it outstanding. Also I did place trades with the techniques and I made some profit as evidence to let other users know that technical analysis would actually make you profit if you use them efficiently and effectively.
Note: this is post is for education purposes, please make your research before placing your trades
I wish to invite @kouba01 @drqamu , @ngoenyi, @sahmie @rajithpriyasad @artist1111 and @mvchacin
You have created a high quality and comprehensive content.
This is a crucial point. Without technical knowledge, traders are essentially gambling. Informed decisions based on technical analysis reduce the risk and increase the chances of success in trading.
I agree completely. Japanese candlesticks provide a visual representation of price movements, making it easier to interpret market trends and make informed trading decisions.
Trading View is indeed a powerful platform. Its extensive range of tools and user-friendly interface makes it an indispensable resource for traders at any level.
On a lighter note and a friendly point that I noticed while going through your post is that at some places there are mistakes probably commited during voice typing. For example , while defining trading view , instead of very equipped there it is Feburary equipped. One round of proof reading will do wonders.
All the best
Funny you, auto tying can cause it on phone thanks for letting me know, or something putting a phone in a pocket can also cause that. I will do well to correct It. I am not sure on how I made the mistake but I am sure it's not far from the two I mentioned. Since I wrote the post for days
Greetings my friend!
If you have made a full participation of this interesting topic a very important topic that we must master when trading, thanks for the invitation.
Success in the dynamic.
I really appreciate your support friend, thanks for honoring my invitation
Excellent work bro. As a seasoned student of the academy you have once again showed your skills in explaining such a lengthy topic
Best of luck
Hearing this is from an professional is really amazing and mindblowing. I really appreciate your amazing comment friend
Es una publicación bastante nutrida de información valiosa. Cuando empecé a investigar el tema en este desafío no había tocado antes el tema de las velas con tal detalle. Ahora el nivel de comprensión y sentido de las graficas me permitirá manejar un criterio mas informado para la toma de decisiones.
Gracias por compartir, saludos y mucho éxito.
Wow it's so amazing to hear how my post influenced your decision and understanding. Indeed it's an honor. I appreciate bro
Buena suerte amigo. ¡Saludos!
Gracias friend
It is clear from your letter how much you have sacrificed and prepared for your appointment. I hope you will be able to write such valuable articles in the future.
Thanks for understanding how much time and energy I put into this entry I really appreciate your support
Greetings friend,
Talking about candlestick patterns, pivot points, and candle trends can seem a bit fancy, but basically, these are like secret codes that help traders understand what might happen in the market. It's like having a treasure map to guide you on your trading journey. Learning about these tools can really boost a trader's skills and make trading more exciting and successful. You've done wonderfully well to deliver at the highest level and I wish you good luck for that.
Upvoted. Thank You for sending some of your rewards to @null. It will make Steem stronger.
It's an honor friend
I'm super excited 😆 to come across something like this.
The *Technical Analysis in trading I'll term it the depth of any market.
Just like you say a farmer going to farm with no farming tools is same as a trader going into trading without knowing it understanding the Technical Analysis.
That's why so many traders lost because of assumptions, wrong understanding and so on.
I so much love the way you present 💝 us with the types of candles sticks. The pattern and so on, it's amazing and indeed valuable to all traders.
Going into indicators, Time frame, volatility, point pivot and many others facts you emphasize on the concept to build a successful trader and trading experience is what I'm so much trying to implement wnd become successful.
I really loved it and so recommend to other traders to learn from.
Please you can also explore my content on same topic
https://steemit.com/hive-108451/@basil20/sec-s18-w1-or-or-mastering-the-markets-with-technical-analysis
I appreciate your detailed breakdown of how to use them effectively. TradingView seems like a handy platform for real-time analysis. Best of luck in the contest