SEC S18-W1 || Mastering the Markets with technical analysis
Introduction |
|---|
Wait!! Do you know 👉 "Knowledge is power" and again "forewarned is forearmed" are definitely the common idioms that highlight the importance of being so well-informed and really prepared. When it definitely comes to really trading in the financial markets, these very sayings couldn't be truer at all. - Then One of the most very powerful tools a dear trader can have in their arsenal is indeed the technical analysis. By well understanding and so well mastering technical analysis, all can really make a more informed and precise decisions and of course potentially increase the trading success.

[Technical Analysis Chart]
Let's me quickly dive into the world of the technical analysis and well explore how it can help us navigate the markets with better confidence.
The Importance of Technical Knowledge in Trading
What is Technical Analysis?
Why is Technical Knowledge Crucial?
1.Pattern Recognition: By well recognizing the patterns in the price movements, all traders can really predict the future trends and so make informed decisions properly.
2.Market Psychology: The Technical analysis always helps understand well the behavior and the sentiment of other traders in the market too.
3.Timely Decision-Making: It massively provides Great 👍 signals for the entry and exit points, as much helping traders time their trades effectively with curiosity.
Key Components of a Technical Chart
When anytime you look at any technical chart, it's definitely like looking at a pretty map of the dynamic market's past behavior.
So Here's what you can gather perfectly from it:
1.Price Action: Here really Synthesize the movement of prices over time.
2.Volume: The very number of shares or the contracts traded within a given period at a time.
3.Trend Lines: Here the Lines drawn to really identify the direction of the market and actions.
4.Support and Resistance Levels: The very Price levels indeed where the market tends to definitely find support as it falls and the resistance as it rises as well.
5.Indicators and Oscillators: The Tools like the moving averages, RSI (Relative Strength Index), and MACD (Moving Average Convergence Divergence) that always help interpret price data.
Reading Candlestick Charts and the Importance of Time Frames
Candlestick Charts
Candlestick charts here are very much regard a type of financial chart really used to describe the price movements. In Each "candlestick" represents a profound specific time period (e.g., a day, an hour) and really provides information about the very opening, closing, high, and low prices during that period in time.

[Candle Stick Identification]
- Body: The unique rectangular part of the candlestick, always showing the opening and the closing prices.
- Wicks (or Shadows): The kind thin lines well extending above and below the body, indeed showing the high and low prices here.
- Colors: Typically, a green 💚 or white candlestick always indicates a price increase, while a red ♥️ or black one indicates a decrease as well.
Significance of Different Time Frames
The Different time frames can tell different stories about the market entirely:
- Short-term (e.g., 1-minute, 5-minute charts): So Ideal for the day traders looking for quick trades to enter.
- Medium-term (e.g., hourly, 4-hour charts): Definitely Useful for swing traders who indeed hold positions for a few days and so on.
- Long-term (e.g., daily, weekly charts): It's regards as the Best for investors and the position traders who hold trades for like weeks, months, or even years as it depends.
By well examining the multiple time frames, all traders can definitely get a comprehensive view of the market's behavior and attention.
Chart Patterns: Continuation vs. Reversal
Chart Patterns
[Chart Trend]
The Chart patterns are indeed formations so created by the very price movements on a chart. These very patterns can well indicate whether the market is so likely to continue in its very current direction or probably reverse.
Continuation Patterns
In the Continuation patterns, it suggest that the dear price trend will definitely continue in its current direction and so on:
- Triangles: The Symmetrical, ascending, and the descending triangles really indicate a continuation of the trend.
- Flags and Pennants: The Short-term continuation patterns that so indicate a pause before the trend resumes.
Reversal Patterns
The Reversal patterns indicate that the trend is about to change direction entirely:
- Head and Shoulders: A very pattern with three peaks point, the middle here being the highest, so indicating a reversal from bullish to the bearish.
- Double Tops and Bottoms: Here we have Two peaks (tops) or troughs (bottoms) definitely at the same level, signaling a pretty reversal.

Setting Effective Stop-Loss Orders
The Chart patterns can always help set stop-loss orders by well identifying critical support and the resistance levels. In For example, if you're indeed trading a head and shoulders pattern here, you might either set your stop-loss just above the very shoulder level to protect yourself against a false breakout during the process.
Utilizing Trading View for Real-Time Technical Analysis
What is Trading View?
The term Trading View is really acknowledge as an advanced charting platform that helps provides a wide range of tools for the technical analysis. It's indeed user-friendly and so suitable for both beginners and the experienced traders as well.
Applying Technical Indicators
1. Accessing Indicators: On the Trading View, you can definitely apply various indicators like the moving averages, Bollinger Bands, and MACD by really selecting them from the indicators menu.
2.Customizing Charts: Here You can definitely adjust the chart type, the time frame, and indeed other settings to suit your trading strategy and techniques.
3. Real-Time Data: The Trading View offers well a real-time market data, properly ensuring we have the most up-to-date information on the market.
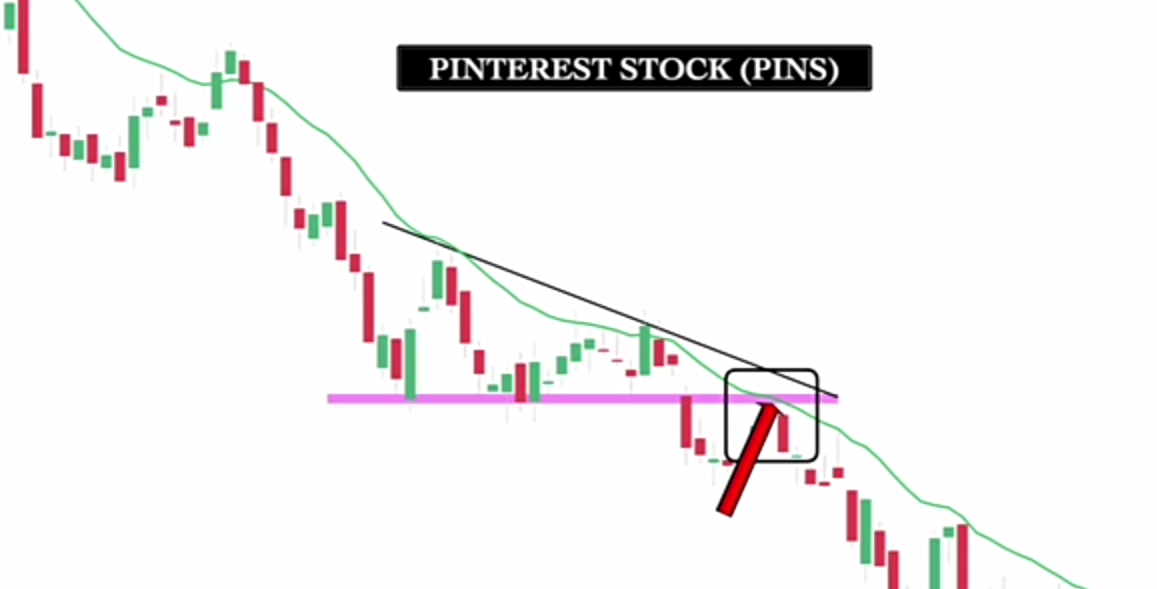
Understanding Support and Resistance with Technical Indicators
Support and Resistance Levels
- Support: A certain price level in where a downtrend can be so expected to pause due to a concentration of demand.
- Resistance: A price level as well where an uptrend can be so expected to pause due to a concentration of the supply.

[Support and Resistance level]
Using Technical Indicators
The Technical indicators like the moving averages and RSI can really help identify support and the resistance levels. For example:
- Moving Averages: A very moving average can really act as a dynamic support or a resistance level. Prices here often bounce off these levels during trends.
- RSI: The technique Relative Strength Index helps to so identify overbought and oversold conditions well, which often do correspond to resistance and the support levels, respectively.

[Settings for Different Indicators]
Pivot Points: Calculation and Significance
What Are Pivot Points?
Pivot points are the technical indicators always used to help determine the very overall trend of the market over different time frames use. They are well calculated using the high, low, and the closing prices of the previous trading session.
Calculating Pivot Points
The very central pivot point (P) is calculated as follows here:
[ P = \frac{(High + Low + Close)}{3} ]
From this here, we can calculate the support and the resistance levels:
- Resistance 1 (R1): ( R1 = 2P - Low )
- Support 1 (S1)*: ( S1 = 2P - High )
- Resistance 2 (R2): ( R2 = P + (High - Low) )
- Support 2 (S2): ( S2 = P - (High - Low) )
Trading with Pivot Points
The Pivot points help to so much identify potential support and the resistance levels for the current trading session in process.
Here's how to use them:
1.Entry and Exit Points: The Traders use pivot points to help determine entry and the exit points. As much If the price is above the pivot point, it then indicates a bullish sentiment, and as well if it's below, it definitely indicates a bearish sentiment.
2. Stop-Loss Orders: Place stop-loss orders definitely just below support levels (for long positions) or above resistance levels (for short positions).
Strategies for Pivot Point Reverse Trading
1. Identifying Reversal Points: At this point 👉 If the very price touches a support level and then starts to reverse, it so can be a signal to buy. Conversely, if it as well touches a resistance level and reverses, it can be a signal to sell, it's indeed great insight.
2.Confirming with Indicators: Using other indicators like the RSI or MACD to really confirm the reversal signal before entering a trade is highly mandatory and recommended.
- By well mastering these very elements of the technical analysis, I admit all can significantly enhance our trading strategies and so well increase our chances of unique success in the markets. Please Remember that, practice and of course continuous learning are the key to becoming proficient in technical analysis term.
I'm pleased in inviting @bossj23, @sahmie and @hahdie to join me while we explore the Technical Analysis Skills together.
Connect me on Steemit
-Thanks 👍 All For Reading-
Las velas así como sus patrones generan una información muy valiosa para los traders, con la cual podrán comprender el sentimiento del mercado.
Curiosamente las velas japonesas son de muy vieja data y me sorprendió saber en mi investigación que siguen siendo muy utilizadas y prácticas en el trading.
Gracias por compartir, te deseo mucho éxito.
I'm super grateful 🙏
TEAM 3
Congratulations! This comment has been upvoted through Curation Team#3. We support quality posts, good comments anywhere and any tags.Muchas gracias por su apoyo.
¡Feliz día!
Thank you, friend!


I'm @steem.history, who is steem witness.
Thank you for witnessvoting for me.
please click it!
(Go to https://steemit.com/~witnesses and type fbslo at the bottom of the page)
The weight is reduced because of the lack of Voting Power. If you vote for me as a witness, you can get my little vote.
My Twitter link
https://twitter.com/EmediongEtok/status/1794823805334085730?t=1xSfsEnlda19dUA53WdJrQ&s=19
Upvoted. Thank You for sending some of your rewards to @null. It will make Steem stronger.
Greeting
Your participation is an incredibly insightful and valuable lecture on mastering the markets with technical analysis. Learning about candlestick patterns, pivot points, candle trends, and technical indicators is indeed an eye-opener and it's amazing how these tools can really help traders make informed decisions. You must be really knowledgeable and skilled to explain these concepts so well.
I'm pleased and it's a pleasure sir 😊
Your breakdown of technical analysis is spot-on! Understanding past data to predict future movements is vital in trading. Recognizing patterns and market psychology can lead to informed decisions. Your explanation of chart components and candlestick patterns is clear and helpful. Wishing you the best of luck in the contest
TEAM 3
Congratulations! This comment has been upvoted through Curation Team#3. We support quality posts, good comments anywhere and any tags.