Steemit Crypto Academy Contest / S19W5: Spotting Market Reversals with CCI
Hello!
Greetings to everyone, I'm excited to be sharing my post with you and also to engage on this amazing challenge. Lask week we discuss on sharkfin model of trading, this week the crypto academy team has brought us with yet another interesting topic still on trading. A strategy for spotting market reversal, using the CCI.
In context the CCI stands for; commodity channel index. It's a tool used in corporation with the technical analysis to sport market reversal. When use properly, we can be able to spot both entry and exit point on the price chart with ease. Elaborating, let's get more details here on;.
Define the term Commodity Channel Index (CCI), explain its role, calculation formula, components, main purpose, history, and interpretation of overbought and oversold values with real-world examples.
| Define the term Commodity Channel Index (CCI) |
|---|
The Commodity Channel Index (CCI) is a technical indicator used in identifying potential price reversals, price extremes, and trend strength in financial markets. It measures the current price level relative to an average price level over a specific period in time.
Key features of CCI:
Momentum-based oscillator: It helps identify when an investment is becoming overbought or oversold.
Unbounded: Unlike some indicators, CCI doesn't have a fixed upper or lower limit.
Sensitivity: It can be quite sensitive to price changes, which can lead to a large number of signals.
The role CCI explained:
As previously mentioned, the CCI is responsible for sporting price reversal and potential overbought and oversold conditions, here are a few concepts about it.
Identifying Overbought and Oversold Conditions:
When the CCI moves above a certain threshold for instance +100, it's a possible suggestion that the market might be overbought, indicating a potential price drop.
Controversy, when the CCI moves below a certain threshold for instance -100, it's also a possible suggestion that the market might be oversold, indicating a potential price increase.
Detecting Potential Trend Reversals:
Divergence between the CCI and price movements can signal potential trend reversals. For example, if the price makes a higher high, but the CCI fails to do so, it could indicate a bearish divergence and a potential downward price movement.
Confirming Trend Direction:
When the CCI is above the zero line and moving upward, it can confirm a possible uptrend.
When the CCI is below the zero line and moving downward, it can confirm a possible downtrend.
However, It's wise to bear in mind that CCI is most effective when used in coalition with other technical indicators joined with fundamental analysis.
Commodity Channel Index (CCI) Calculation Formula
The CCI can be calculated using the formula;
CCI = (TP- SMA) / (0.015×Mean Deviation)
Defining terms,
CCI = Commodity Channel Index
TP = Typical Price(High + Low + Close) / 3
SMA= Simple Moving Average of the Typical Price
The Mean Deviation = Average absolute difference between the Typical Price and the SMA
Steps use to Calculate CCI:
- Calculate Typical Price (TP) for each period:
- Add the high, low, and closing price for each period and divide the sum by 3.
- Calculate Simple Moving Average (SMA) of the Typical Price:
- Sum the Typical Price for the specified number of periods.
- Proceed by dividing the sum by the total number of periods.
- Calculate Mean Deviation:
- Subtract the SMA from each Typical Price.
- Proceed by Taking the absolute value of each difference present.
- Sum these absolute values.
- Continue by dividing the sum by the total number of periods.
- Calculate CCI:
- Subtract the SMA from the current Typical Price.
- Divide the result by (0.015 * Mean Deviation).
Application
Let's consider that we want to calculate the CCI for a 20-period lookback,
- Calculate TP for each of the last 20 periods.
- Calculate the SMA of the TP for the last 20 periods.
- Calculate the mean deviation of the TP from the SMA for the last 20 periods.
- Use the current TP, SMA, and mean deviation to calculate the CCI.
The constant 0.015 is used to scale the CCI values to a more practical range.
The Main Purpose of CCI
The main purpose of the Commodity Channel Index is to identify potential price extremes and trend changes.
By comparing the current price to an average price over a specific period, the CCI helps traders and analysts determine:
Overbought and oversold conditions:
When CCI values move drastically above or below certain levels (ideally +100 and -100), it suggests that the market might be overbought or oversold.Potential trend reversals: A complete Divergence between the CCI and price action can signal potential trend changes.
Trend confirmation: CCI can be used to confirm the direction of an existing trend.
History of the CCI.
The Commodity Channel Index was first introduced by Donald Lambert in 1980. Originally published in Commodities magazine now rate as the Futures, it was initially designed to identify cyclical trends within the commodities market.
Since then, the CCI has proven to be a versatile indicator applicable to a wide range of financial instruments, including stocks, bonds, and forex. Its collective adaptability and effectiveness in identifying potential price extremes and trend changes have contributed to its widespread adoption among traders and analysts.
interpretation of overbought and oversold values with real-world examples.
It has been pointed out that When the CCI rises above the +100 level, it suggests that the market is overbought. This indicates that the asset's price has risen rapidly and sharply, and there's a higher probability of a price correction or reversal.
- Real-world example
Supposed a popular solar company stock that has experienced a significant price increase due to positive earnings reports and increased investor interest in this company, The CCI for this stock might surge above +100, indicating an overbought condition. At this point, traders might interpret this as a signal as a potential take profits or consider selling the stock for a short term.
Controversial, when the CCI drops below the -100 level, it's a possible suggestion that the market is oversold. This indicates that the asset's price has drop rapidly and sharply, and there's a higher probability of a price retest or reversal.
- Real-world example:
During a market-wide sell-off, a particular stock might experience a sharp decline. Its CCI could drop below -100, indicating an oversold condition. A majority of traders might see this as a buying opportunity, anticipating a potential price recovery.
However, while the +100 and -100 levels are common thresholds, they might not be suitable for all markets or timeframes. As Overbought and oversold conditions can persist for extended periods. It's important to use CCI in collaboration with other technical indicators and fundamental analysis for a more precise analysis.
Explain overbought and oversold levels, CCI buy and sell signals. Show historical charts demonstrating the use of CCI to spot reversals, and discuss potential limitations of CCI and methods to mitigate them.
Briefly Explain conditions overbought and oversold use CCI buy and sell signals
The Commodity Channel Index measures the current price level relative to an average price level over a specific period. These levels could be Overbought or Oversold Levels.
Overbought:
When the CCI rises above the +100 level, it possible suggests that the market is overbought. This means the asset's price has risen rapidly, and it might be due for a correction or reversal signal.
Oversold:
When the CCI drops below the -100 level, it possible suggests that the market is oversold. This means the asset's price has declined rapidly, and it might be due for a retest or reversal.
CCI Buy and Sell Signals
While the CCI principal is use in conditions of overbought and oversold conditions, it can also be used to generate potential buy and sell signals:
- Buy Signal:
A potential buy signal can occur when the CCI moves from below the -100 level back above this line. This insinuate a possible market reversal from oversold conditions.
- Sell Signal:
A potential sell signal can occur when the CCI moves from above the +100 level back below the line. This possibly suggests a possible market reversal from overbought conditions.
However it is important to lay emphasize for CCI as a leading indicator, meaning it often signals potential price changes before they occur, it's not always accurate 100%, and false signals can occur. Therefore, combining CCI with other indicators and employing risk management strategies is required.
historical charts demonstrating the use of CCI to spot reversals

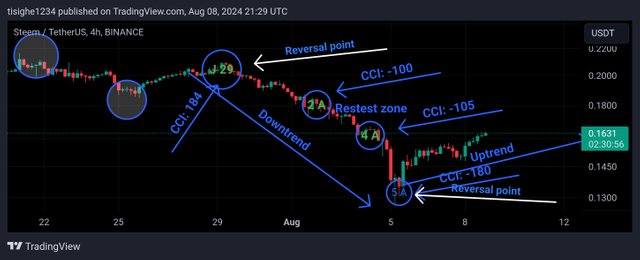
The Steem/USDT chart exhibits a clear downtrend since 24 -Jul-2024. The price has consistently formed lower highs and lower lows, indicating strong bearish momentum.
The area areas where the circles represent overbought and oversold conditions. Getting into more details we are going to examine the CCI values at this point in different time frames to have a more practical analysis.
- Primary data.
| Date | price | CCI | condition |
|---|---|---|---|
| July 24 | 0.2160 | 203 | overbought |
| Reversal point | downtrend | ||
| July 25 | 0.1880 | -110 | oversold |
| Reversal point | Uptrend | ||
| July 29 | 0.2085 | 184 | oversold |
| Reversal point | downtrend | ||
| Aug 2 | 0.1800 | -100 | oversold |
| Reversal point | price correction | ||
| Aug 4 | 0.1667 | -105 | divergence |
| Reversal point | downtrend | ||
| Aug 5 | 0.1280 | -180 | oversold |
| Reversal point | Uptrend |
Potential limitations of CCI and methods to mitigate them.
While the CCI is a valuable tool in trading, it's important to be cautious of its limitations and implement strategies to mitigate them.
Limitations of CCI
Sensitivity to Market Volatility: CCI can be highly sensitive to market volatility. Extreme price movements can generate false signals.
Lagging Indicator: While CCI is considered a leading indicator, it can sometimes lag behind price movements, most especially during a rapid market change.
Overbought Or Oversold Levels: The traditional +100 and -100 levels might not be optimal for all markets or timeframes. Determining appropriate levels can be subjective.
False Signals alarm: Like any indicator, CCI can generate false buy or sell signals, leading to potential losses.
Mitigating CCI Limitations
Combine with Other Indicators: Using CCI in conjunction with other technical indicators (e.g., RSI, MACD, moving averages) can help confirm signals and reduce the risk of false positives.
Adjust Overbought or Oversold Levels: Experiment with different overbought and oversold levels based on historical data and market conditions to find optimal values.
Consider Market Context: Analyze the broader market conditions and asset-specific factors before relying solely on CCI signals.
Use Higher Timeframes: Analyzing CCI on higher timeframes (e.g., daily, weekly) can help filter out short-term noise and improve signal reliability.
Backtesting: Backtesting your CCI-based trading strategy can help assess its performance and identify potential areas for improvement.
Risk Management: Employ strict risk management techniques, such as stop-loss and take-profit orders, to protect your capital.
By understanding CCI's limitations and implementing these mitigation strategies, traders can improvise the effectiveness of their trading decisions.
Briefly Discuss the advantages and disadvantages of CCI, its use with other indicators, the risks of false signals, and the impact of cryptocurrency volatility on the effectiveness of CCI.
Discuss on the advantages and disadvantages of CCI
Advantages of CCI
Identifies Overbought and Oversold Conditions: CCI is effective at pointing out when a market is overbought or oversold, providing potential trade entry and exit points.
Detects Trend Changes: Simply observing divergences between price and CCI, traders can anticipate potential trend reversals.
Versatility: CCI can be applied to various asset classes, including stocks, commodities, forex, and cryptocurrencies.
Simplicity: The CCI calculation is relatively straightforward, making it accessible to traders of different experience levels.
Disadvantages of CCI
Lagging Indicator: sometimes CCI can be a lagging indicator, meaning it might generate signals after a significant price movement has already occurred. This is in case of rapid market changes
Sensitivity to Volatility: Extreme price fluctuations can lead to false signals, as CCI is sensitive to market volatility.
Subjective Interpretation: Determining overbought and oversold levels can be subjective, as there's no universally agreed-upon threshold.
False Signals: Like any indicator, CCI can produce false signals, leading to potential losses if not used in conjunction with other analysis methods.
By having a proper understanding both the strengths and weaknesses of CCI, traders can effectively incorporate it into their trading strategies while minimizing potential risk.
Combining CCI with Other Indicators
To improve the reliability of trading signals and reduce the risk of false breakouts, combining CCI with other technical indicators is a common practice.
CCI and RSI: Both CCI and RSI are momentum oscillators. Comparing their readings can provide additional confirmation of overbought or oversold conditions. A divergence between the two indicators might signal a potential trend reversal.
CCI and Moving Averages: Moving averages can help confirm the overall trend direction. A bullish crossover (faster moving average crossing above slower moving average) while CCI is above zero can strengthen a buy signal.
CCI and MACD: Combining CCI with MACD can provide a more comprehensive picture of price momentum and potential trend changes.
Using Different Timeframes for CCI Analysis
Analyzing CCI on multiple timeframes can offer valuable insights in trading.
Short-term Timeframes say; 5-minute, 15-minute.:
Useful for identifying short-term trading opportunities and scalping strategies. However, be aware of increased market noise and potential for false signals.Medium-term Timeframes say; 1-hour, 4-hour:. Suitable for day trading and swing trading. Provides a balance between short-term volatility and long-term trends.
Long-term Timeframes like; Daily, Weekly.:Ideal for identifying major trend changes and long-term investment opportunities. Reduces the impact of short-term noise.
The risks of false signals
The Commodity Channel Index is a valuable tool for traders, but it's essential to take into consideration the risk of false signals. It can lead to incorrect trading decisions and potential financial losses.
The Impact of False Signals
Market Entry Errors:False buy signals can lead to purchases at unfavorable price levels, resulting in losses if the market continues to decline. Controversial, false sell signals can force the sale of an asset before a significant price increase, missing out on potential profits.
Reduced Confidence: A series of false signals can diminish a trader's confidence in their trading system, leading to hesitation and miss in opportunities.
Mitigating the Risk of False Signals
Combine with Other Indicators: As mentioned before Using CCI in conjunction with other technical indicators can help confirm or contradict signals, reducing the risk of false signals.
Consider Market Context: Fundamental analysis and broader market trends can provide additional context for CCI signals, helping to filter out false breakouts.
Risk Management: making use of stop-loss and take-profit orders can limit potential losses and protect profits.
Backtesting: proper backtesting a trading strategy based on CCI can help identify potential weaknesses and improve its effectiveness.
The Impact of Cryptocurrency Volatility on CCI Effectiveness
Cryptocurrency markets are renowned for their extreme volatility. This high level of price fluctuations can significantly impact the effectiveness of the Commodity Channel Index (CCI).
Challenges.
Frequent False Signals: The rapid and unpredictable price swings in cryptocurrencies can lead to numerous false overbought and oversold signals.
Difficulty in Determining Optimal Parameters: Given the dynamic nature of cryptocurrency markets, finding the optimal CCI parameters (e.g., period length, overbought/oversold levels) can be challenging.
Lagging Indicator: In highly volatile markets, CCI's tendency to lag behind price movements can be exacerbated, reducing its effectiveness as a leading indicator.
Mitigating the Impact
Shorten CCI Period: Due to the rapid price movements in cryptocurrencies, using a shorter CCI period (e.g., 5-10) can help capture more immediate price changes.
Combine with Other Indicators: Using CCI in conjunction with other indicators, such as RSI or Bollinger Bands, can help filter out false signals and provide additional confirmation.
Adjust Overbought/Oversold Levels: Given the extreme volatility, it might be necessary to adjust the standard overbought/oversold levels (+100, -100) to better suit the cryptocurrency market.
Higher Timeframes: Analyzing CCI on higher timeframes for instance daily, weekly can help reduce the impact of short-term volatility and provide a clearer picture of overall market trends.
Risk Management: Implementing strict stop-loss and take-profit orders is crucial to manage the increased risk associated with cryptocurrency Trading.
Choose a recent Steem/USDT chart, use CCI to analyze and identify reversal points, annotate the chart, and explain the method used. Discuss the validity and usefulness of these reversals for trading.
On A recent Steem/USDT chart, use CCI to analyze and identify reversal points, annotate the chart,
Chart analysis with CCI
Method used
The basic knowledge of analysing charts using CCI is by making used of technical analysis. To analyze this chart there are 3 things we will have to to consider, the overbought/oversold conditions. The divergence and the zero line cross over.Overbought/Oversold Readings: Extreme CCI values above +100 or below -100 can signal potential overbought or oversold conditions, respectively. A reversal back towards the zero line could indicate a potential trend change.
Divergence: When the price makes a new low (or high), but the CCI fails to make a new low (or high), it suggests a potential divergence. This could be a precursor to a trend reversal.
Zero Line Crossovers: A CCI crossover of the zero line can provide additional confirmation of a potential trend change. A bullish crossover (from below to above) suggests a potential uptrend, while a bearish crossover (from above to below) indicates a potential downtrend.
Potential Reversal Zones Without CCI
For further confirmation, Previous support levels that have held in the past might act as resistance on retests. A strong bounce off these levels could indicate a potential reversal.
Also If the price breaks below a key support trendline, it could signal a continuation of the downtrend. However, a strong bounce off the broken trendline might suggest a potential reversal.
- Statistics:
On July 29. The market record a price of 0.2085$. at the instant the price witness a sharp reversal down trend.
The CCI reading was seen to be 184. Indicating a potential overbought. Looking keenly we see that the price reversal on at a previous support level, this confirms a sell at this point. Some trader can begin to take profit while some will see it as an opportunity to sell.
The price moved as predicted in a strong downtrend. To a new point on the 2 of August. Here the the CCI record -100 which is the condition for potential oversold. It then retest for some hours before finally continue it momentum in a down trend.
On August 4, the correct again with price this time at 0.1666$ , but the CCI reluctantly remain around the -100 line recording a value of -105. This indicates a possibility of a divergence. An indication that another reverse might occur. It is wise to wait at this point.
Few days later the price break again in a strong downtrend to a lower low of 0.1260$ . At this point, the CCI record a new value of -188 . This is a possibility of oversold conditions. There's a possibility of a reversal.
The market finally reverse as predicted and cross the zero from below. A possible buy option. At this point trading can begin to buy and take note of risk management. The market finally reach a previous support of 0.1667 at the instant.
Validity of CCI Reversals
Market Conditions: CCI works best in trending markets. In ranging or sideways markets, it can generate false signals.
Indicator Lag: CCI is a lagging indicator, meaning it confirms trends rather than predicting them. This can lead to delayed entry or exit points.
Overreliance: Solely relying on CCI for trading decisions is risky. Combining it with other indicators and price action analysis is crucial.
Usefulness of CCI Reversals
** Identifying Potential Turning Points:** CCI can help identify potential overbought or oversold conditions, which may precede price reversals.
Confirming Trend Changes: When CCI diverges from price or crosses the zero line, it can confirm a potential trend change.
Risk Management: Traders can use CCI signals to set stop-loss and take-profit levels based on potential reversal zones.
Combining CCI with other indicators such as RSI, Moving average, MACD And considering multiple time frames Can provide better options for Market confirmation.
Describe a CCI-based trading strategy, explain the buying and selling rules, provide historical or simulated examples showing the strategy's effectiveness, and discuss potential modifications to improve its performance.
Describe a CCI-based trading strategy
Overbought or oversold conditions.
This strategy capitalize on potential price reversals by pointing out overbought and oversold conditions using the CCI.
Strategy basic Rules.
Indicator Setup: Apply CCI with a standard period of 14 to the desired timeframe chart for instance 4-hour TF.
Overbought Condition: When the CCI crosses above the +100 level, it indicates a potential overbought condition. We Wait for a price pullback and a CCI retracement to the 0 line before considering entering a short position.
Oversold Condition: When the CCI crosses below the -100 level, it suggests a potential oversold condition. Wait for a price bounce and a CCI retracement to the 0 line before considering a long position.
Stop-Loss: Place a stop-loss order a few pips below the recent swing low for long positions and a few pips above the recent swing high for short positions.
Take-Profit: Determine a profit target based on risk-reward ratio or support/resistance levels.
Risk Management: introduce protective stop-loss orders to protect your funds.
Backtesting: Test the strategy on historical data to evaluate its performance.
explain the buying and selling rules using CCI
Buying Rules
Oversold Condition: When the CCI moves below the -100 level, it typically indicates an oversold condition. This might lead to a potential buying opportunity.
Wait for a Pullback: majority of traders prefer to wait for a price bounce and a CCI retracement towards the zero line before entering a long position. This can reduce the risk of false signals.
Divergence: If the price makes a lower low, but the CCI fails to make a new low, it's a bullish divergence. This could be a good buying signal.
Trend Confirmation: If the CCI is above the zero line and moving upward, it generally confirms an uptrend. A buy signal can be considered if the price is also showing bullish momentum.
Selling Rules
Overbought Condition: When the CCI moves above the +100 level, it typically indicates an overbought condition. This might signal a potential selling opportunity.
Wait for a Pullback: Similar to buying, waiting for a price pullback and a CCI retracement towards the zero line can improve the accuracy of the signal.
Divergence: If the price makes a higher high, but the CCI fails to make a new high, it's a bearish divergence. This can be a strong selling signal.
Trend Confirmation: If the CCI is below the zero line and moving downward, it generally confirms a downtrend. A sell signal can be considered if the price is also showing bearish momentum.
Points to Consider
False Signals: CCI, like any indicator, can generate false signals. It's essential to use it in conjunction with other technical indicators and price action analysis.
Market Conditions: CCI works best in trending markets. Its effectiveness can be reduced in range-bound markets.
Risk Management: make use of protective stop-loss and take-profit to manage risk on a given trade.
Backtesting: Testing the strategy on historical data can help evaluate its performance.
Historical or simulated examples showing the strategy's effectiveness,.
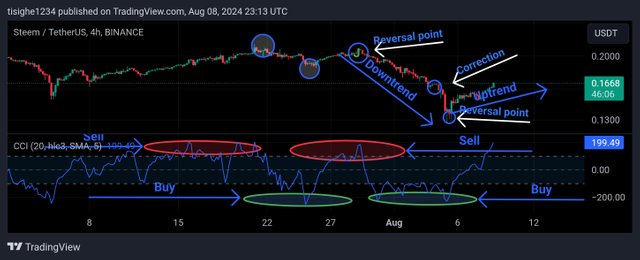
Above is an annotated chart showing the possibility point for overbought and oversold. While considering the CCI values at this point, one can make judgement on which actions to take next.
The red circle indicates higher CCI +100 and at this zone the market is likely to retested or reverse direction. It's best note for traders to confirm a sell when it has crossed the zero line from above.
The blue circle indicates conditions for oversold. Here the CCI read -100 and beyond. Also the market is likely to retest. Just like before , we wait for it to cross the zero like before any informed decisions.
Discuss potential modifications to improve its performance.
Following up in context, we have repeatedly mentioned the fact that CCI use as a solo indicator is not sufficient enough to provide conditions for overbought or oversold as far as false signals, rapid market Changes could alter it effectiveness.
However in combination with other indicators Such as RSI, moving average and MACD, it is possible to provide more accurate information about the price chart. And possible confirmations as well.
Not withstanding. We should always consider risk management and back testing our strategy on a specific price commodity before execution.
To conclude, the Commodity Channel Index (CCI) is an essential tool for technical analysis traders, helping to identify potential overbought and oversold conditions. Nevertheless, CCI should not be used in isolation as a solo indicator.
Combining it with other indicators and a solid understanding of price action is essential for making informed trading decisions. While CCI can signal potential trend reversals, it's crucial to remember that it's a lagging indicator and can generate false signals, especially in volatile market conditions. By carefully considering its strengths and limitations, traders can effectively incorporate CCI into their trading strategies.
I hereby invite the following person to join me participate in this contest. @sahmie, @fombae and @@@daprado1999
Best regards: @rafk
Thank you, friend!


I'm @steem.history, who is steem witness.
Thank you for witnessvoting for me.
please click it!
(Go to https://steemit.com/~witnesses and type fbslo at the bottom of the page)
The weight is reduced because of the lack of Voting Power. If you vote for me as a witness, you can get my little vote.
Upvoted! Thank you for supporting witness @jswit.
Upvoted. Thank You for sending some of your rewards to @null. It will make Steem stronger.
Very informative post wish you best of luck
thanks for your contibution my dear.
Your post provides an insightful explanation of the Commodity Channel Index (CCI) and its practical application in trading. The way you broke down the concept and demonstrated its use with the Steem token is both informative and engaging. Your step by step approach makes it easier for others to understand and apply the CCI in their own trading strategies. Its clear you've put in a lot of effort and I appreciate your contribution. Good luck with the contest I hope you achieve great success!
Thanks for finding my post interesting sir. i do appreciate your time and effort.
The Commodity Channel Index (CCI) is one valuable tool for holding you to identify overbought and oversold conditions in the market. If the CCI rises above +100, it alludes to an overbought situation that could hint at a bearish reversal didFinish. On the other hand, a reading under -100 suggests an oversold situation, and indicates that prices may soon shift higher. Further confirmation of future trend changes can be found by watching when price movements run parallel or diverge from CCI readings. Because even if we can achieve strategic consistency for high probability setups, these signals do provide some insight into a potentially different way to trade .it may help assist in decision-making processes. thanks for sharing my friend.
Some of the major points I think that CCI is a useful instrument for traders and analysts.
Calculation Formula:
Interpretation:
Looking at the performance of this segment, it can be concluded that CCI is most suitable to be used in conjunction with other technical and fundamental instruments. I have to concur with you on the group aspect. I hope you stand well in this focus competition.
Thanks much for sharing my points on the topic sir
Great post on CCI. The way you explore details about CCI is great informative. You create each title in very well which can help readers to understand potential about CCI in simple term. Overall you created nice post. Keep up.
That's cool to see you find interest in my work sir. Thank you....