Steemit Crypto Academy Contest / S14W5 -Exploring STEEM/USDT Trading
Hello everyone!
I hope you are all doing well, I am also fine by the Grace of Almighty Allah. Today, I am happy to take part in the exciting challenge hosted by SteemitCryptoAcademy Community's Week 05 Engagement Challenge Contest. The theme of this engagement challenget is Exploring STEEM/USDT Trading This is very interesting topic without any further delay so let share my thoughts about this.
.png)
Design by me on canva
Trading Strategies:
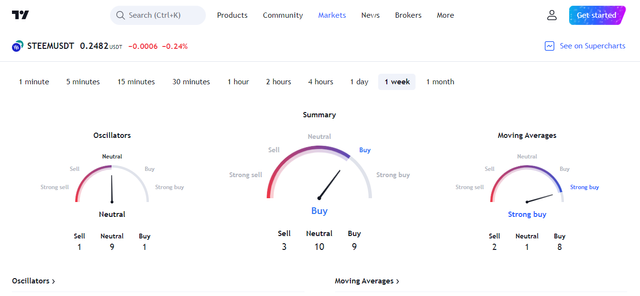
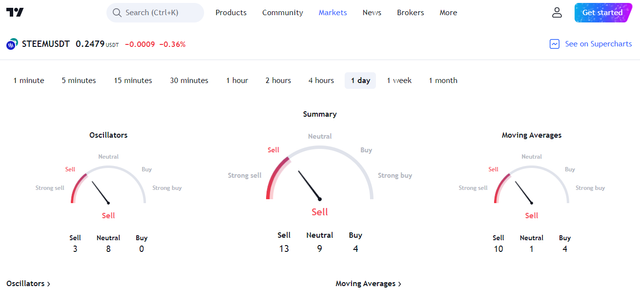
Using RSI and Moving Averages for Trading STEEM/USDT |
|---|
Relative Strength Index (RSI):
As we know relative Stregth Index (RSI) is a popular momentum indictor use by traders to evaluate the magnitude of recent price changes and RSI values above 70 typically suggest that an asset is ovrbought potentially indicating a sell signal while values belw 30 might signify an oversold condition signal a possible buy.
Moving Averages in Trading:
Acording to Moving average smoth out price data showing the averag price of an asset over a specifie period and When different moving averages intersect such as a short term like 20-day and crossing above or below a long term one like 50 days and they generat signal and A golden cross "shorter MA crosing above the long MA" often indicates a buy signal and while a "death cross" shorter MA crosing below the longer MA can signal a sell opportunity.
Combining RSI and Moving Averages for Entry/Exit:
We know traders often combin RSI indiction with moving average crosovers to confirm entry and exit points and for instance if RSI suggests over bough conditin above 70 & a death cros occur in moving average and it could streng then the sell signal and Conversely and RSI indicatig over sold conditions below 30 along side a golden cross might confirm a buy signal.
Confirming Trends with the Stochastic Oscillator |
|---|
Understanding the Stochastic Oscillator:
We know Stochastic Oscillator is a momentm indicator used to identify potentia trend reversals and Readings above 80 typicaly suggest over bough conditionand while readings below 20 indicate over sold conditions anD More over the %K line crosing above the %D line from below 20 might signal a bullish trend and while crssing below the %D line from above 80 could signal a bearsh trend.
Integrating Stochastic Oscillator with RSI and Moving Averages:
We knowTraders often use the Stochastic Oscillator readig to confirm signal obtained from RSI and moving averages andfor instance if RSI indicat over bought conditions and a berish cross over appear in the moving averagesand a confirmation fromthe Stochastic Oscillator crosing below 80 might provide aditional support to the sell signal.
Understanding Bollinger Bands for STEEM/USDT |
|---|
Basics of Bollinger Bands:
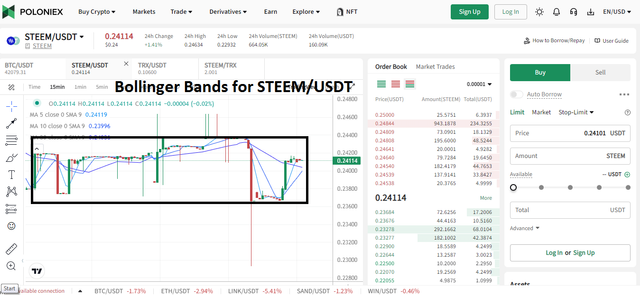
We know about the basis of Bollinger Bands are a technical analysi tool that consist of three lines like in a simple moving averge typically a 20-day SMA and in the middle and two bands ploted abve and below thisaverage and these bands are calculated at a distance of two standrd devations from the SMA.
Upper Band Interpretation:
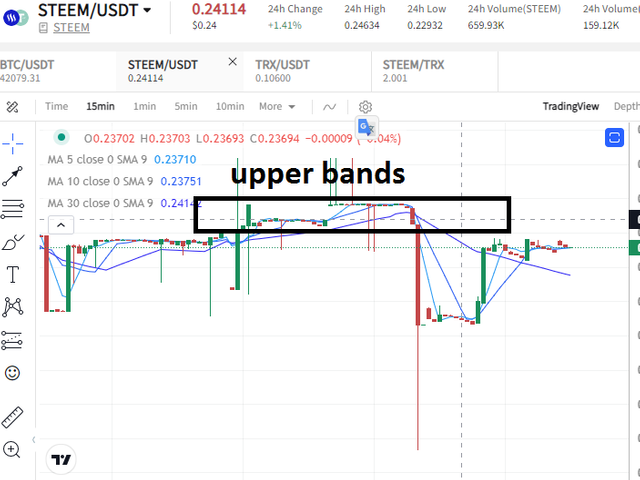
We know about the Interpretation of the upper band upper band repreents a level two standard deviatins above the 20-day SMA and this bandacts as a ceiling for the price movemnt & indicates potential over bought conditions and When STEEM/USDT touche or surpases this upper band andit might signal that the price is relativly high comparedto recent volatility and Traders might consider this as a point where the asset could experienc a pullback or a period of consolidation.
Lower Band Interpretation:
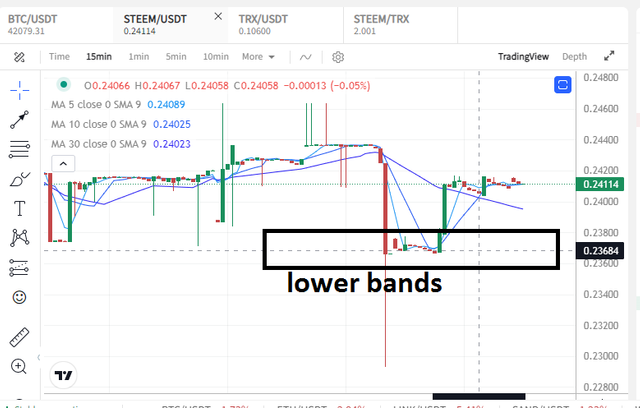
We know about the lower band is position two standard deviatin below the 20-day SMA andthis band servs as a floor for the price movemnt and suggest potential over sold condition and If the price touche or fall belw this lower band and it might signal that STEEM/USDT is relatively low compred to recentvolatility andTraders may interpret this apotential buying oppotunity or a point where the price could rebound.
Utilizing Bollinger Bands for Trading Insights:
Absolutely Bollinger Band are those who help traders visalize volatility & potential priece reversalpoints and a breach or touch of the band might sugest potential change in trend direction an reversal points and traders often combine Bollinger Band with other technical indictors to confirm signal and make informed trading decision .
Importance of Supplementary Analysis:
Yah Bollinger Band provide valuable insigt they work best when complement with and other technical indiators & analysis method and Market condition newevents & overall trend should also be consider to validat signal derived from Bollinger Band.
How to identify a buy or sell signal using MACD for the STEEM/USDT pair |
|---|
Understanding MACD for STEEM/USDT Trading:
MACD Calculation:
MACD Line: We have tofind the difference b/w the 12 period & 26 period Exponetial Moving Averge EMAs of STEEM/USDT prices.
Signal Line: After that we have to Calculate a 9 period EMA of the MACD line.
Interpreting Signals:
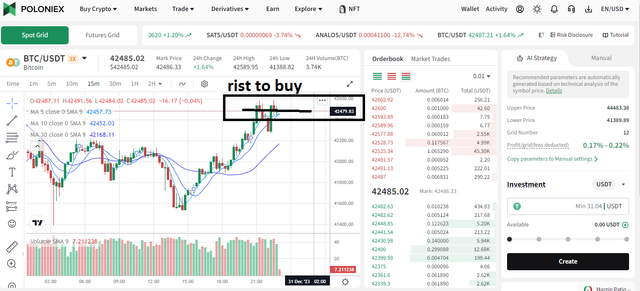
Buy Signal: The main thing ist Buying postion when the MACD line croses above the signal line andit suggest a potetial bulish trend or a buy opportunity.
Sell Signal: In which position we have to sell when the MACD line croses below the signalline and it indiates a possible berish trend or a signal t o sell.
Using the MACD Histogram:
- The histogram represnt the difference b/w the MACD line & the signal line giving inight into the momentum o f price movement and a rising histogram after a cross over can confirm a strengtheing trend.
Applying Strategy:
- Buy Decision: Tha main thing buying method in whicch position we have Look for the MACD line cros sing above the signal line while bth are below zero and a rising histogram add confirmation.
- Sell Decision: The next main thing in which place we have sell and MACD line crosse below the signal lin e while both a re above zero conider selling and decreas histogram reinforce this signal.
Considerations:
- We know Cryptocurrency market can be highly volatil and so combine MACD signal with other indiators or analysis method and always practie risk management and cons'ider backtesting your strategy before live t rading.
How important is a stop-loss when trading STEEM/USDT, and how can it be set based on technical analysis? Why is it essential to diversify positions when trading the STEEM/USDT pair? |
|---|
Importance of Stop-Loss in STEEM/USDT Trading:
Risk Control:
we know that a stop loss act as a safety measue, limited potentia l loses in STEEM/USDT trade.
Its crucial for manging risk & preventing substantial capitl loss if the market move against your predition.
Setting Stop-Loss Using Technical Analysis:
Identifying Key Levels: we have to use tools like chrt & indicator t o find support & resitance level.
Volatility Consideration: We adjust stop loss level base o n the assets volatility to accomodate price fluctutions.
Indicator Confirmation: We are confirm stop loss level us ing indicator like MACD or movingg average to align with potential reve rsal or breakout point.
Importance of Diversification in STEEM/USDT Trading:
Risk Mitigation:
Diverifying across differentt asset or pairs, not solely STEEM/USDT, help spreadd risk.
Its reduce vulnerablity to any single asset negative movement, safegu rding against unexpected downturn.
Market Exposure and Opportunity:
Diversifiation provide exposure various market trend & sectors, potentialy balanc losses] from one asset with gain from others.
It allowss traders to size opportunitie across different asset, maximizing pootential gain & minimizing reliancce on the performane of single asset .
Risk Management:
We avoid over exposure to specific risk associate with STEEM/USDT, such as project relateed issu, market volatillity, or regulatry changes.
Balance & manage risks acros a diversifid portfolio, ensuring stabillity in the face of uncertinties.
Apart from commonly used indicators, what other leading indicator could be useful to analyze the behavior of the STEEM/USDT pair? and how can trading volume be interpreted to predict future movements of STEEM/USDT? ,?center>
STEEM Project Fundamentals:
Market Sentiment on STEEM:
Market Trends and Technical Analysis:
External Events Impacting STEEM/USDT:
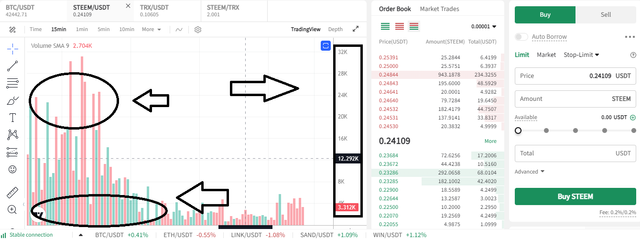
Exammining the mood & opinion express across soccial platforms like Redit, Twitter, & crypto forum can serve as unique indictor and tracking sentim ents surounding STEEM can offer insight into potenntial shifts in mraket sentiment and positive or negative emotionn express by the comunity might precede price moveements, acting as a lea ding indicator. Interpreting Trading Volume for STEEM/USDT PredictionVolume Dynamics:We have to Understand the implicat ions of trading voluume in STEEM/USDT tradding:
Here's my today's engagement challenge, and I hope you enjoy it alot and Thanks a lot for checking out my activities, and I'll see you all in my next post and need your support in the form of comments and vote. Take care of yourselves. Goodbye, my Steemit family. My Introduction Best Regards By @qasim78
|
|---|


Upvoted. Thank You for sending some of your rewards to @null. It will make Steem stronger.
U welcome
The death cross in moving averages is used by many traders to confirm either to place a trade or to exit a trade. This point is really insightful from you.
Ty each, the the Bollinger band a newbie can easily learn resistances and supports. This works more better then used together with other indicators.
Thank you teaching us in a such a way. Wish you the best in this contest.
Thank you so much @ngoenyi
Salutaciones, apreciado @qasim78! 🚀
Me sumerjo en la minuciosidad y exhaustividad de tu análisis concerniente al par de negociación STEEM/USDT. Tus esfuerzos al explicar diversos indicadores técnicos como MACD, RSI, Bollinger Bands, Stochastic Oscillator, y su aplicación para identificar señales de compra o venta, son dignos de elogio.
La inclusión de gráficos y capturas de pantalla de plataformas de negociación introduce un componente visual que eleva la comprensión de estos indicadores complejos. Es evidente que has dedicado tiempo y esfuerzo a investigar y presentar la información de manera meticulosa.
Además, encuentro perspicaces tus explicaciones sobre establecer el stop-loss y la importancia de diversificar posiciones. La gestión del riesgo a través de órdenes de stop-loss es, sin duda, crucial en el comercio, y tu demostración de cómo establecerlo utilizando plataformas de negociación agrega un valor práctico a tu contribución.
Adicionalmente, abordaste la importancia de eventos externos y anuncios en la influencia de la negociación del par STEEM/USDT. Esta conciencia de factores fundamentales añade profundidad a tu análisis, reflejando una comprensión holística del mercado.
En resumen, tu entrada está habilidosamente estructurada, llena de información, y demuestra un sólido entendimiento de los aspectos técnicos y fundamentales del comercio. Prosigue con el excelente trabajo y aguardo con interés más de tus contribuciones en el futuro! 🌟📈
Thank you so much
Hey friend just as I have expected you have written so so well and I learned something New from your article
New and latest update about steam wood tremendously influence the price or trends of steem in the crypto market over a period of time, careful analysis of fundamentals is necessary before making trades in crypto market
Thanks for sharing such quality post, please engage on my entry https://steemit.com/hive-108451/@starrchris/steemit-crypto-academy-contest-s14w5-exploring-steem-usdt-trading
Thank you so much @starrchris
Absolutely. Diversification is a powerful strategy to navigate various market trends and sectors. Your post is Well articulated and I appreciate your contribution!
Thank you so much @jaytime5
Your breakdown of using RSI and moving averages to figure out when to buy and sell was spot-on. You really went into detail and made it easy to understand.
And when it came to explaining Bollinger Bands, you did a great job showing how they help us see how crazy the market is and when it might change direction. I gotta say, your advice on stop-loss and spreading out your positions was super helpful for us traders. It's all about managing the risks, right?
And you're absolutely right, keeping an eye on external events, announcements, and updates is key when trading STEEM/USDT. Those things can really shake things up!
Overall, great job on breaking it all down in a way that's easy to understand and apply.
Thank you so much @sahmie
You're welcome friend.
Hello my dear friend how are you and I hope you are fine and whenever I was going through the all the post I think the everybody who is participating have very deep knowledge of the crypto and they have must gown through so much I drink over here that's the reason I think they have better understanding and they are writing in a better way and using keywords I have read the question how to set a stop loss honesty it took a long time for me to understand how to set the setting for stop loss and when I see the answer you have given just remind to think you must have good understanding are you must doing trading so you have better analysis for the setting stop loss
These Indicators are just remarkable to do the settings of stop loss and you have done really great job and wish you best of luck
Thank you so much @shanza1
Your welcome
El indicador RSI lo has explicado bien y con detalles para el entendimiento de su aplicación. En general la explicación es clara en el resto de los indicadores.
Has hecho un gran esfuerzo, te deseo mucho éxito.
¡Feliz Año Nuevo!
Thank you so much @casv
Hello friend greetings to you. Hope are having good time there.
You said that relative Stregth Index (RSI) is a popular momentum indicator used by traders to evaluate the magnitude of recent price changes. This is very valid point. You have explained all the tools and their functions very well. The example it's usage make it too much easy for the reader to understand your idea. Along with these technical tools and technical analysis we must need to watch for the fundamentals always.
I believe the stoploss is too much important in crypto market. It protect your portfolio from a huge lost. Diversifying is a best option though. It's perfect example is hedging.
I wish you very best of luck here in the contest.
Thank you so much @shahid2030