Steemit Crypto Academy Contest / S14W4 - Fibonacci Retracements.
 )
)

In the world of trading, so many resources are put into use to assist in understanding the market to make trading profitable.
Indicators are among the resources used by trading experts to read and analyze the market. Among these indicators are the Fibonacci retracements. What is it all about? Follow along. As i explain more about this indicator.
In your own words, what are Fibonacci Retracements and what are they used for?
This can be said to be an indicator used in technical analysis for ascertaining the supports and resistances of a particular asset. It is used in determining the various levels which the price of an asset will have to retrace before its continuation on the present trend.
These retracement levels come from the Fibonacci sequence ratios
Like I said earlier, they are used for determining the retracement levels of the price of an asset pair after moving up before continuing the trend.
It is usually drawn on the chart by using the two extreme points within the chart and dividing the vertical distance by the Fibonacci ratios.
Using the Fibonacci retracement, the line on the chart is drawn from the highest price which marks the beginning of the retracement to the lowest price which considered as a complete reversal from where the price moved.
Then horizontal lines are used to determine the various price levels where supports and resistances can be found. Some widely known levels are 23.6%, 38.2%, 50%, and 61.8%.
Having known that the horizontal lines are used to show the supports and resistance. It helps traders to decide where and when to place their buy, sell or stop orders. As an example, if a trader notices that uptrend retraced to the 61.8% fib level, he can decide to buy from there, knowing that the trend is still continuing. However, he will put his stop loss just slightly below the 61.8% level, with the knowledge that if it returns and breaks down the 61.8% fib level, the trend may have reversed.
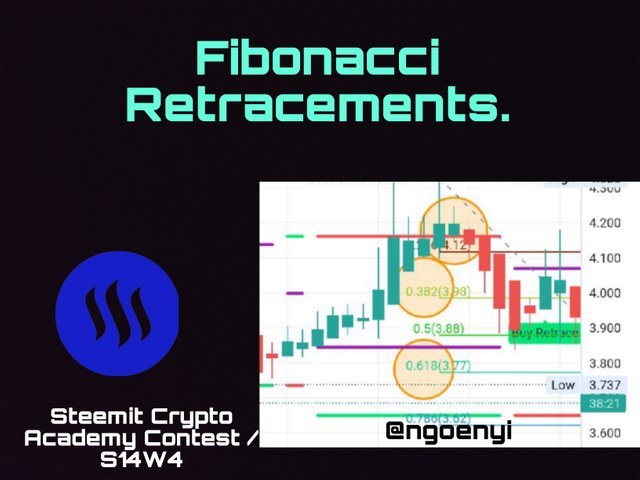
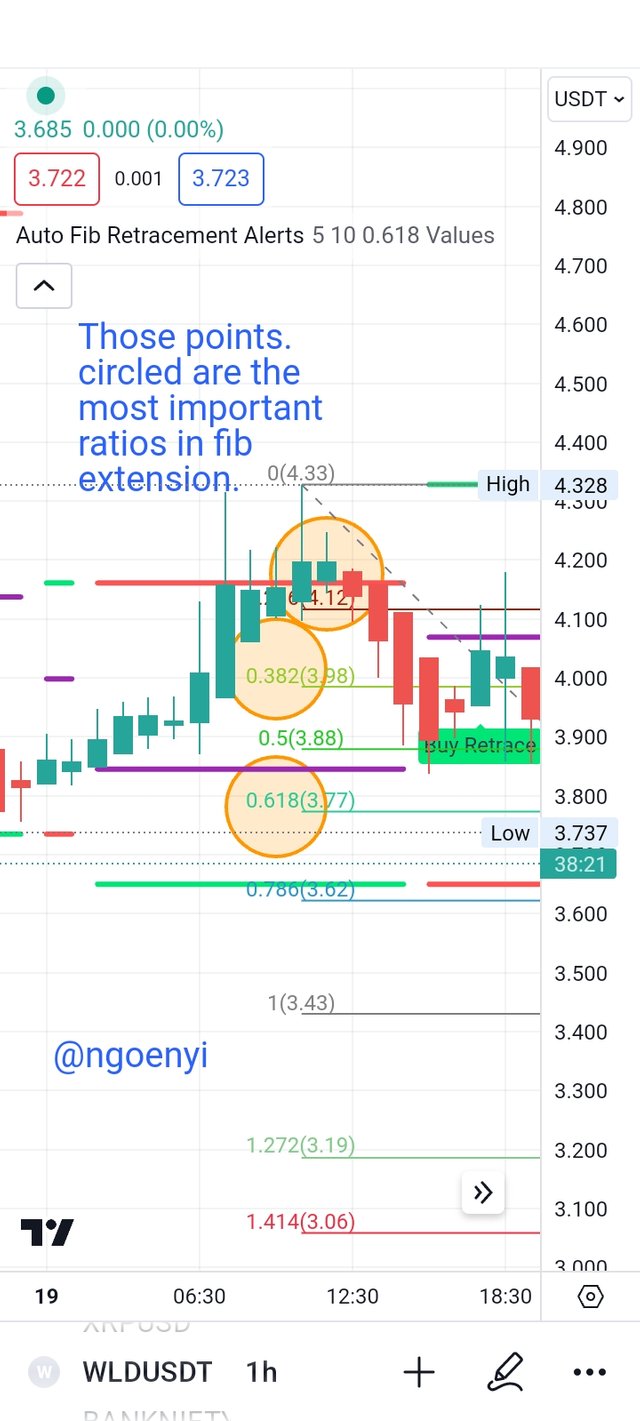
Explain the most important Fibonacci levels and show at least one example on a chart of a cryptocurrency pair.
There are important Fibonacci retracement levels. These levels are the 61.8%, 38.2% and 23.6% levels. These are basically the most important levels every trader should lookout for.
This is shown in the screenshot below.
 from tradingview app
I am using the chart of WLD/USDT to illustrate this.
We can see that after hitting the high at $4.470, there was a massive selloff such that the 23.6% support at $4.119 could not hold it. It broke down
to 50% at the price of 3.878.
To show that the level is not a strong support, after a minor retracement, it broke the support once more to 61.8% support
At this point, we also saw a minor retracement upwards. But the selling pressure was so high that it could not maintain the support, so the price finally went back to where it came from that is at 100% level.
This simply means that for this particular pair, the retracement was purely 100% as the price went back to where it started its movement.
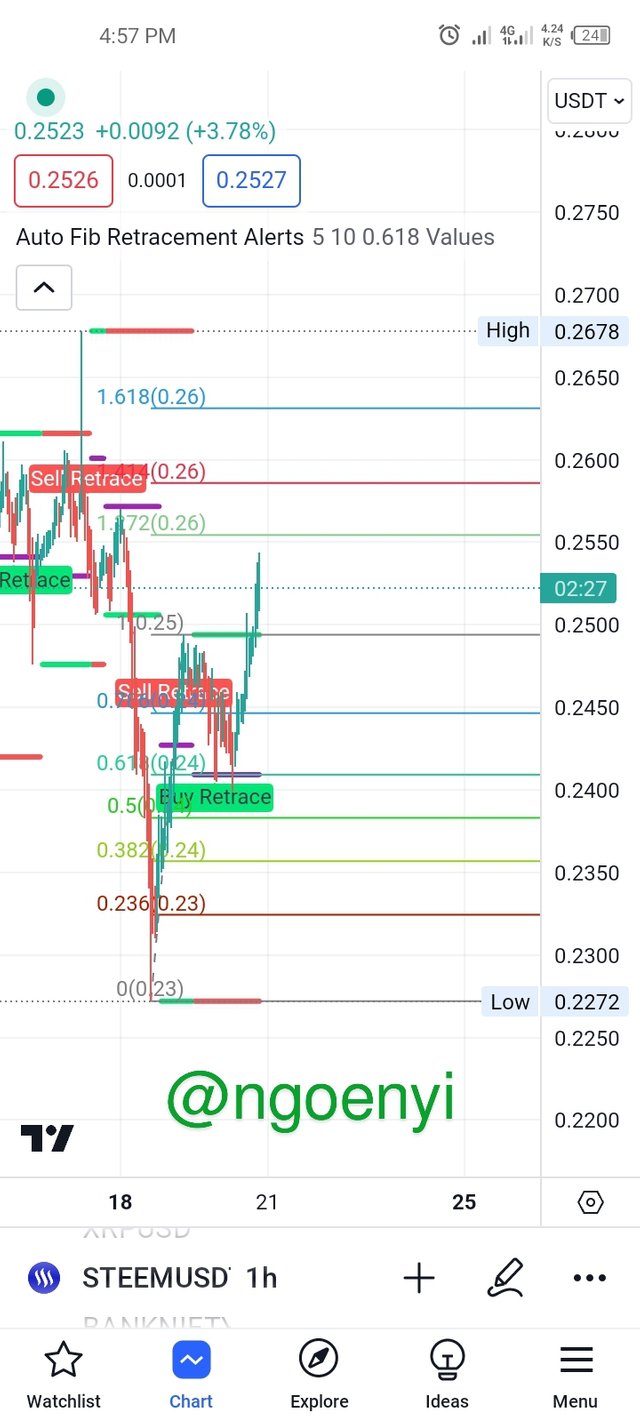
Use the STEEM/USDT chart and show how Fibonacci retracements work.
 from tradingview app
From the chart above we noticed that we had a change in trend from doqnward trend to upward trend. Thus, the price started from its lowest point of $0.2272.
However, because of the upward movement of BTC which propels the market prices of alts upwards, STEEM defied all the important resistances and touched $0.25 mark before retracement. It retraced to 61.8% fib level ($0.24) which was a support.
At this point a trader can easily buy the asset pair and would have enjoyed the ride beyond the 100% fib ratio to the current price of $0.2529 as at the time of writing.
So, all the horizontal lines on the chart are resistances that can turn to be support or vice versa.
So a trader can look out for the movement of price on this levels and use it to either buy or sell a particular crypto pair.
Advantages and disadvantages of Fibonacci retracements.
Advantages
° It helps a trader to determine the supports and resistances in a chart.
° The indicator helps trader to know the best place to buy or sell an asset.
° it makes it easier for the trader to know where to place his stop loss, to minimize losses which is risk management.
° It can be used with other indicators to confirm entry or exit in a trade.
° it can be used to forecast future prices of an asset.
Disadvantages
There is no guarantee of making profits using the Fib Retracement indicator since it is subjective in nature.
It cannot confirm whether a signal is good, weak or bad.
It is better used in a higher time frame to get a more accurate result.
It cannot be relied on solely to take a decision. It must be used in conjunction with other forms of technical analysis.
Using this indicator takes time to understand before profiting from it.
Conclusion
Fibonacci retracement is a good tool for technical analysis. Like any other tools for analysis, it has its own advantages and problems. So to use.it effectively, we need to take time to understand it and also know of other indicators which we will.combine with it to give us the best result.
I therefore invite @yancar @steemdoctor01, @startchris and @sahmie to take part in this contest here Success to everyone!
This is my introductory post here
Absolutely, you've highlighted an important aspect. Fib Retracement, being subjective, indeed requires careful interpretation. Utilizing it in a higher time frame for more accuracy is a wise approach.
And you're right, relying on it solely might not be sufficient; incorporating it with other forms of technical analysis provides a more comprehensive view. It's a tool that evolves with understanding and experience. Well said!
I have also participated in the contest, do well to check it out and engage. My post link to the contest.
Upvoted. Thank You for sending some of your rewards to @null. It will make Steem stronger.
Greetings ma,
You've hit the nail on the head. Fibonacci retracement is indeed a powerful tool for technical analysis. Like any other analysis tool, it has its pros and cons.
To make the most of it, it's important to invest time in understanding how it works and also explore other indicators that can complement it. By combining different tools and indicators, we can enhance our analysis and get more accurate results. So keep learning, experimenting, and finding the best combination that works for you. Wishing you success in the contest.
Yes, combining Fibonacci with other tools and indicators will yield more positive results. And dedicating more time to understanding it will truly help. Thank you for your valuable comment. I appreciate
Hence, taking the time to go deeper into understanding it will definitely be beneficial. I'm glad you found my comment valuable, and I appreciate your kind words.
Saludos cordiales hermosa amiga ngoenyi, muchas gracias por la invitación a esta espectacular participación para explicarnos esta herramienta del análisis técnico llama retrocesos de fibobacci, darnos sus lineas de porcentajes mas utilizadas y realizar un buen analisis en el gráfico solicitado, exitos amiga.
Your are always prompt in response to an invite. That is quite commendable. Thank you for the feedback. Hoping to read your entry soon
📊 ¡Excelente explicación, @ngoenyi! 📈👩💼 Tu entrada sobre los Retracimientos de Fibonacci en el concurso de la Steemit Crypto Academy es muy informativa y bien estructurada. 👏💡 Me gusta cómo destacas la utilidad de esta herramienta en la identificación de niveles clave de soporte y resistencia en los gráficos de precios. 📉📈
La presentación de ejemplos prácticos, como el gráfico de WLD/USDT y el de STEEM/USDT, ayuda a visualizar cómo se aplican los niveles de Fibonacci en la práctica. 📊📈 También, aprecio que hayas mencionado tanto las ventajas como las desventajas de utilizar los retracements de Fibonacci. 🌟
Has proporcionado un análisis detallado que beneficiará a aquellos que buscan comprender mejor esta herramienta de análisis técnico. 🤓📉 ¡Gracias por compartir tu conocimiento! 🚀💙
Oh, thank you so very much for the detailed comment. I am glad that you have rated my entry excellent. I will keep doing my best. Learning never ends at all. I appreciate
☃❄🎄This is a manual curation from the @tipu Curation Project.☃❄🎄
Also your post was promoted on 🧵"X"🧵 by the account josluds
@tipu curate
Upvoted 👌 (Mana: 5/6) Get profit votes with @tipU :)
Explicas claramente que los niveles de retroceso de Fibonacci representadas en líneas horizontales determinan los puntos de soporte y resistencia con los cuales los operadores pueden decidir entrar o salir.
Mostraste un detallado análisis técnico del gráfico WLD/USTD y el STEEM/USTD, aplicando los retrocesos de Fibonacci, que facilitan la comprensión y entendimiento de este indicador.
Gracias por compartir, saludos y éxitos.
https://twitter.com/Celina58042963/status/1737555281322672253?t=ckgfl8Thb84Xpi8KAeCmnA&s=19
HOW YOU CAN RECOVER YOUR STOLEN FUNDS NOW I was scammed over ( $275,000 ) by someone I met online on a fake investment project. I started searching for help legally to recover my money, and I came across a lot of Testimonies about HACKER STEVE. I contacted him, providing the necessary information and it took him and his team of experts about 36 hours to locate and help recover my stolen funds. I am so relieved and the best part was, the scammer was located and arrested by local authorities in his region. I hope this helps as many out there who are victims. I strongly recommend Steve professional services for assistance with swift and efficient recovery. You can reach him for any form of recovery (Crypto, Credit card, Gift card, Forex, NFT, etc) on Gmail: [email protected]