How To Read Candlestick Charts In Different Time Frame & Information about Buy-Sell: Homework Task #2
Hello Steemian ..
Today I am going to write a Homework article made by professor @stream4u. How To Read Candlestick Charts In Different Time Frame & Information about Buy-Sell(Support & Resistance).
.jpg)
Introduction :
CandleSticks chart Can be confusing and most difficult to understand, especially for novice traders, cryptocurrency trading can be overwhelming. Despite the complexity of this chart, know that it is not at all impossible to learn it. Below is some important information about cryptocurrency charts that can help you.
These CandleSticks (Candles) charts are an essential element in cryptocurrency trading charts. Essentially these CandleSticks provide us with a visual representation of how crypto prices move over a period of time. Just by looking at the 6 main components of these CandleSticks, you will find out how Treaders react to certain market Triggers.
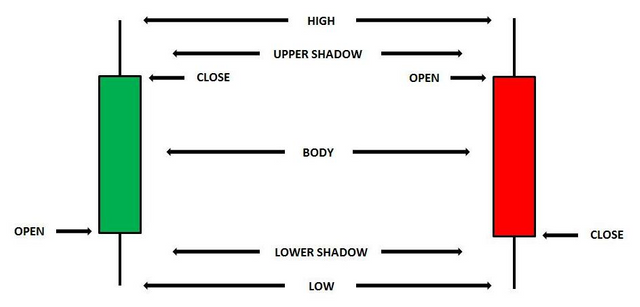
CandleSticks Chart Components (Candles)
Open - This represents the coin price at the start of the trading period.
Close - This represents the coin price at the end of the trading period.
High - This is the highest price reached during a trading session.
Low - This is the lowest price reached during a trading session.
Body - This shows the difference between the start and end price of the trade.
Shadow - It shows how high or low the starting and ending price of a trade is.
Green Candlestick: Means the candle is up. because the closing price of the period closed higher than the opening price. A rising candle can also be called a Bullish candle, which means that the close is bigger than the open.
Red Candlestick: Candle is down. This means that during that period the closing price closed lower than the opening price. Now, this candle can also be called a bearish candle, which means that the close is smaller than the open.
Time Frames & Trader Types
Types of Traders
Scalper: Are traders who tend to open and close transactions for a short period of time. Traders of this type tend to use charts with time frames between 1 M (minutes) to 30 M (minutes).
Day Trader: Is a trader who usually does open-close transactions within a day. They usually choose a time frame between hourly and daily.
Swinger: Is a trader who usually does open-close transactions in the range of days to weeks, even months. This trader usually uses the 4H time frame, daily to monthly.
forum.mt5.com
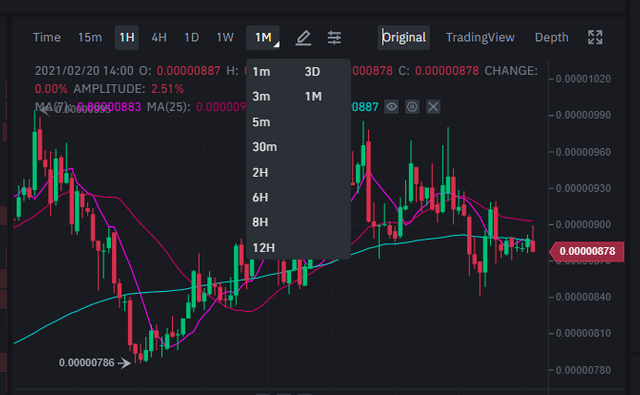
Time Frame
The time frame is a certain period of time that is determined to observe price movements. Each Time Frame has a different price movement. In general, there are time frames of 1 minute, 5 minutes, 15 minutes, 30 minutes, 1 hour, 4 hours, 1 day, 1 week, and 1 month.
It is in the above timeframe that a candlestick is formed on the chart. With the many time frame choices, it is easier for us to analyze the direction of price movements on the chart.
( )
)
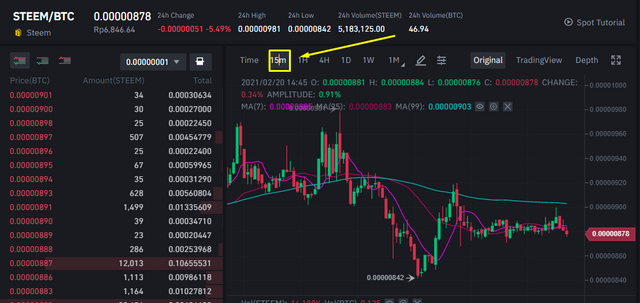
15 minutes view:
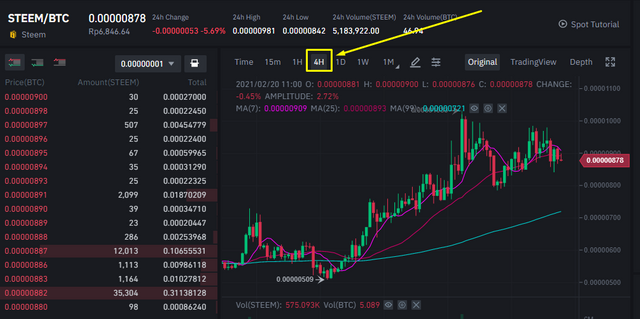
4 hours view:
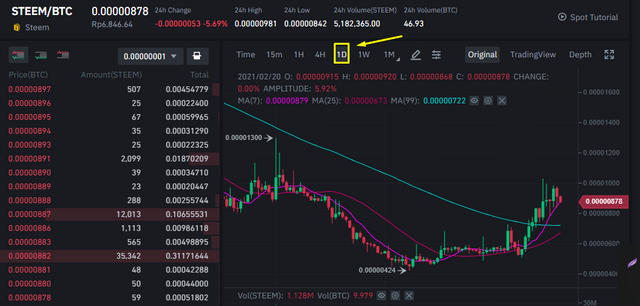
1 Day view:
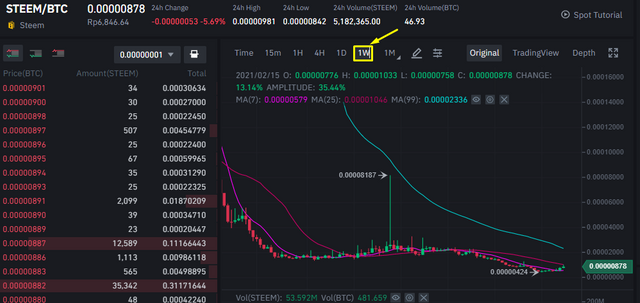
1-week view:
Resistance and support
Support is the lower limit of a range of price movements.
Resistance is the upper limit of a range of price movements.
Reference from
Buy at Support
a trader is recommended to open a "buy" position on a pair when the price is at the lowest level (support level). With the expectation that after reaching the lowest level then the price will reverse up.
Sell at Resistance
In contrast to a buy position, a "sell" position should be opened when the price is at the peak (resistance level), where the price will reverse from rising to falling.
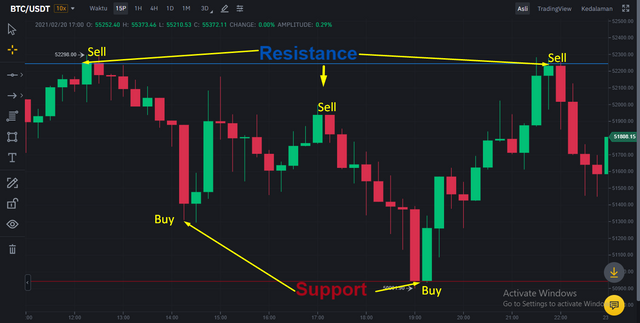
Like the candlestick chart screenshot, I took above using the 15m (minute) Time frame on the BTC \ USDT trade. Moving the BTC price for the last 15 minutes shows that the resistance level shows below the price of $ 52298 which is a very good position to sell your asset and at Support, level shows the lowest price within 15M is $ 50901 which is a very good position to buy.
All of these screenshots I took on the Binance exchange market
BAHASA INDONESIA
Halo Steemian..
Hari ini saya akan menulis artikel Homework yang dibuat oleh profesor India @stream4u .Pada kesempatan ini saya ingin menambahkan sedikit pengetahuan dasar dalam melihat grafik Grafik CandleSticks (Lilin) dalam perdagangan mata uang cryptocurrency.
Pengenalan :
Grafik CandleSticks (Lilin) Bisa membingungkan dan paling sulit dipahami, terutama bagi pedagang pemula, perdagangan cryptocurrency bisa sangat banyak. Terlepas dari kerumitan grafik ini, ketahuilah bahwa sama sekali tidak mustahil untuk mempelajarinya. Di bawah ini adalah beberapa informasi penting tentang grafik mata uang kripto yang dapat membantu Anda.
Grafik CandleSticks ini (Lilin) adalah elemen penting dalam grafik perdagangan cryptocurrency. Intinya CandleSticks ini memberi kita representasi visual tentang bagaimana harga crypto bergerak dalam jangka waktu tertentu. Hanya dengan melihat 6 komponen utama dari CandleSticks ini , Anda akan mengetahui bagaimana para Treader bereaksi terhadap Triger pasar tertentu.
Komponen Grafik CandleSticks (Lilin)
Open - Ini mewakili harga koin di awal periode perdagangan.
Close - Ini mewakili harga koin di akhir periode perdagangan.
High - Ini adalah harga tertinggi yang dicapai selama sesi perdagangan.
Low - Ini adalah harga terendah yang dicapai selama sesi perdagangan.
Body - Ini menunjukkan perbedaan antara harga awal dan akhir perdagangan.
Shadow - Ini menunjukkan seberapa tinggi atau rendah harga awal dan akhir perdagangan.
Candlestick Hijau : Berarti candle naik karena harga penutupan periode itu ditutup lebih tinggi daripada harga pembukaan. Candle naik bisa juga disebut Bullish candle yang berarti close lebih besar dari open.
Candlestick Merah : Candle turun. Ini berarti bahwa pada periode itu harga penutupan ditutup lebih rendah daripada harga pembukaan. Nah si candle ini bisa juga disebut bearish candle yang artinya close lebih kecil dari open.
Time Frame & Tipe-Tipe Trader
Tipe-Tipe Trader
Scalper : Adalah trader yang cenderung melakukan open-close transaksi dalam jangka waktu yang singkat. Trader tipe ini cenderung menggunakan chart dengan time frame antara 1 M(menit) sampai 30 M(Menit).
Day Trader : Adalah trader yang biasa melakukan open-close transaksi dalam rentang waktu sehari. Mereka biasanya memilih time frame antara hourly sampai daily.
Swinger : Adalah trader yang biasanya melakukan open-close transaksi dalam rentang waktu harian sampai mingguan, bahkan hitungan bulan. Trader ini biasa menggunakan time frame 4H, daily sampai monthly.
Time Frame
Time frame adalah kurun waktu tertentu yang ditentukan untuk mengamati pergerakan harga. Setiap Time Frame memiliki pergerakan harga yang berbeda – beda. Secara umum, terdapat time frame 1 menit, 5 menit , 15 menit , 30 menit, 1 jam , 4 jam, 1 hari, 1 minggu, dan 1 bulan. Di software trading lain bisa saja berbeda.
Dalam jangka waktu di atas itulah satu candlestick terbentuk dalam chart. Dengan adanya pilihan time frame yang banyak, kita bisa lebih mudah dalam menganalisa arah pergerakan harga di dalam chart.
()
15 menit view:
4 jam view:
1 Hari view :
1 Minggu view :
Resistance and support
Support merupakan batas bawah dari sebuah range pergerakan harga.
Resistance merupakan batas atas dari sebuah range pergerakan harga.
Buy at Support
seorang trader direkomendasikan untuk membuka posisi "buy" pada suatu pair saat harga berada di level terendah (level support). Dengan ekspektasi setelah mencapai level terendah kemudian harga akan berbalik naik,
Sell at Resistance
Berkebalikan dengan posisi beli , posisi "sell" sebaiknya dibuka saat harga berada di puncak (level resistance), dimana harga akan berbalik dari naik ke turun.
Seperti Screenshot grafik candlestick yang saya ambil diatas dengan menggunakan Time frame 15m (menit) pada perdagangan BTC\USDT.Pergerankan harga BTC selama 15 terakhir menunjukkan bawah level Resistance menunjukan pada harga $52298 yang mana ini posisi yang sangat bagus untuk menjual asset anda dan pada level Support menunjukkan harga terendah dalam kurun waktu 15M adalah $50901 yang posisi ini sangat baik untuk membeli .
Reference : forum.mt5.com
All of these screenshots I took on the Binance exchange market
Jangan Lupa Bahagia

@levycore,
The above sentences detected as copied and pasted from certain sourcesforum.mt5.com.
PLAGIARISM isn't supported, hence can you please attach the sources to those particular phrases in your article? OR phrase/explain it in your own way.
Thank You.
@stream4u
Crypto Professors : Steemit Crypto Academy
#india #affable
@stream4u Thank you for correcting my homework, I've added a reference to the sentence.I hope my task can be accepted.
Hi @levycore
I am accepting now, however, the source still incorrectly added. Please go through How to Applying Markdown
Thank You For Showing Your Intrest in Steemit Crypto Academy
You have completed the homework task and made a good post, explained very nicely about How To Read Candlestick Charts In Different Time Frame & Information about Buy-Sell(Support & Resistance).
Remark: Homework Task Completed.
Thank You.
@stream4u
Crypto Professors : Steemit Crypto Academy
#india #affable
shared on twitter : https://twitter.com/LEVYCORE/status/1363104896476618760
After @stream4u 's tutorial, I have lot learn about candle chart which was very much unknown to me earlier. now from your homework I can find much better idea and practical example of it. thank you very much