Steemit Crypto Academy | Season 2, week4, part 1 : Time Analyzing ( BingBon Apps Trading Made easy )
BingBon Download Link : Android / IOS
About BingBon
bingbon is an exchange application that has many advantages, bingbon is the top 2018 exchange application, in this application there are many types of coins that you can buy or sell, apart from supporting crypto trading, the exchange also offers a number of other trading products including: Forex, oil , gold, securities, etc.
by 2021, bingbon already has more than 450,000 regular users worldwide, in the second quarter recorded trading volume reached a value of $ 2.020 million in a period of 500 hours.
Time Analysis
in this section I will teach you how to analyze a coin crart in several types of time, this is very important because many of the traders do not see time-based charts and immediately trade.
- first I will show some time divisions for displaying the coin price chart.
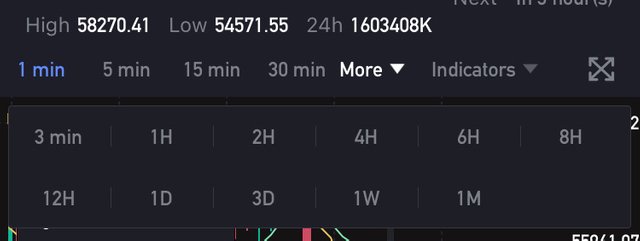
in the picture above we can see several displays of the type of time that we can choose to analyze the coin price chart.
- then we will see a graph based on the time we choose.
- first we will look at the graph in the span of 1 minute / bar.
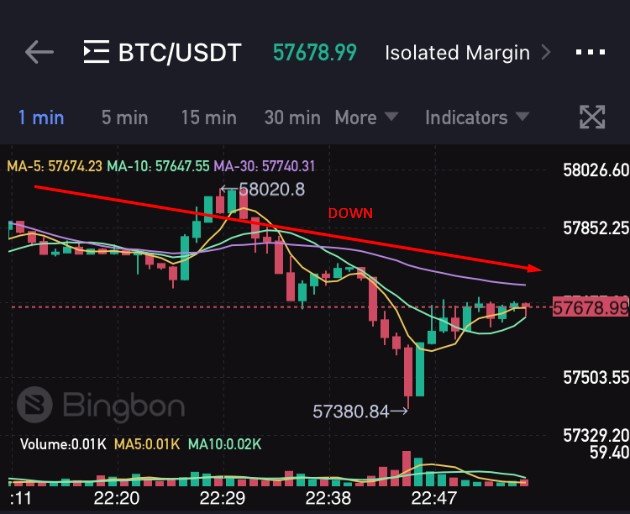
in the picture above is a chart display of bitcoin prices within 1 minute / bar, there we can see that the price of bitcoin shows a decreasing graph even though it is still fairly stable.
My question is, what would you do if you were in this position whether you would buy or sell ...? You can immediately answer in the comments section.
- Next we will see the chart in 5 minutes / bar.
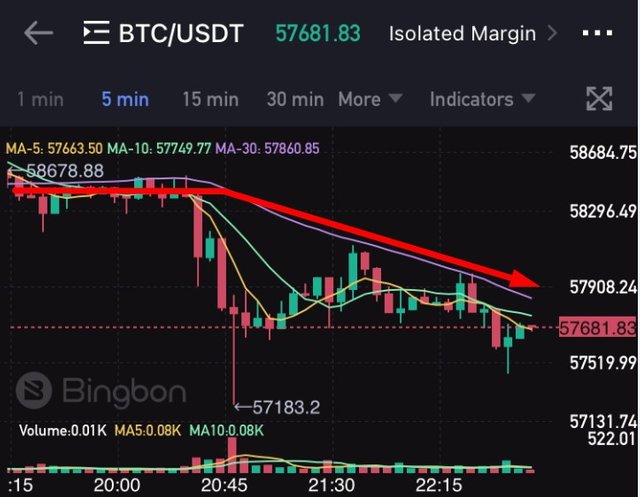
Let's look at the image above, the chart is different from the first image, it can change your decision in an instant, this is what you need to observe properly before trading.
- Next we will see the graph in 15 minutes / bar.
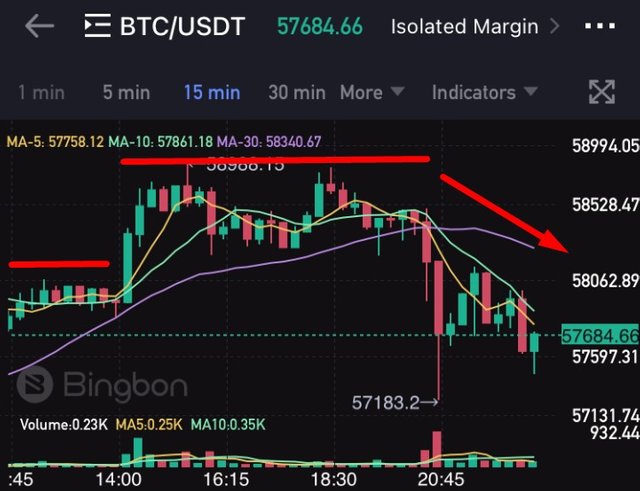
If you are trading within 15 minutes and the price of bitcoin will move like in the picture above, assume the start line is at the far left and the stop is at the far right of the bar, what will happen ..? please answer in the comments section.
- then we look at the bitcoin price chart for 30 minutes / bar.
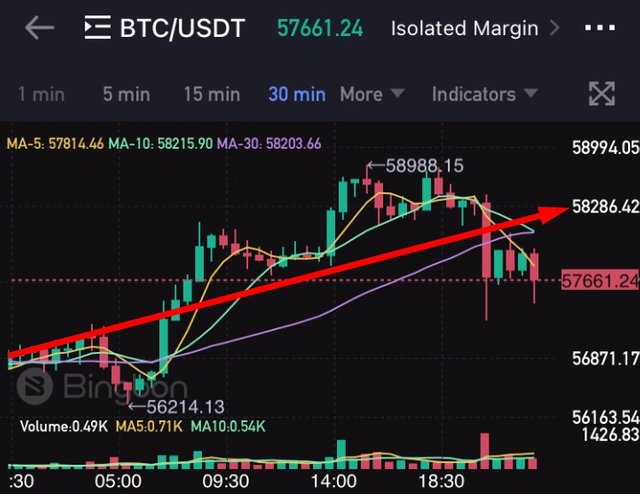
The chart above shows that the price of bitcoin has increased, maybe if you want to trade in long-term you will choose buy bitcoin.
conclusion
At this time, we can conclude the points.
- analyzing the time is very important before determining a trade (buy / sell).
- charts in different types of time influence our decisions before trading.
- if you are trading in the short term it is very important that you keep an eye on the charts.
- and if you are trading in the long term, it would be better if you did the analysis of the time in the longest time.
homework
- download bingbong apps on your smartphone.
- make 5 trades on 5 different types of coins.
- use your demo account to trade.
- buy / sell in the trade.
- create posts and screenshots of all actions.
other lessons
- by @Levycore | Steemit Crypto Academy Season 2 : Selling and Buying NFT
- by @stream4u | Steemit Crypto Academy | Course By @stream4u - Crypto Margin Trading & Crypto Leveraged Tokens Trading.
- by @kouba01 | Steemit Crypto Academy Season 2-Week4 | Cryptocurrency Trading with RSI
Special Thanks
@steemitblog
@steemcurator01
@steemcurator02
You've got a free upvote from witness fuli.
Peace & Love!