Double Top and Wedge Trading - Crypto Academy S6W2 - Homework Post for @imagen
Hello Crypto friends,
I believe you are all doing great and well.
With joy of heart, I hereby Make my submission to the assignment given by Prof @imagen on the topic "Double top and wedge trading".
Please follow along as we embark on this wonderful journey.
Explain in your own words the concept of Double top, Double bottom and wedges.
How to interpret each one?
Explain in your own words the concept of Double top, Double bottom and wedges.
How to interpret each one?
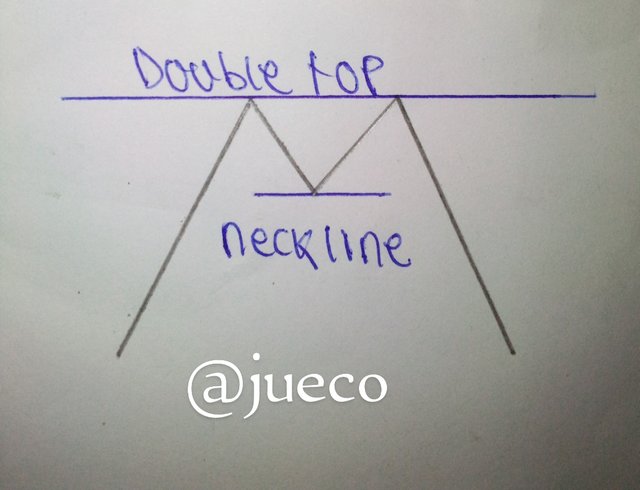
Image made by me
A double top which is also known as a double roof can be explained to be a chart pattern that is usually created at the end of a bullish trend .
It is a chart pattern that usually denotes a downtrend, in other words, it can be called a trend reversal pattern.
The double top is formed as two consecutive highs of nearly same price is separated by a minimum price on the crypto chart.
The minimum price level is known as the double tops.
The peak in this chart usually represents the resistance line and the neck line depicts the support line. And this chart pattern is only confirmed when the price drops below the support line which is the neckline, thus indicating a high probability for the price to continue in a downtrend.
The double top pattern shows that the demand is more than the supply up to the first top, then it's price reverses, showing that the supply is now more than the demand, thus causing a fall in the price of the cryptocurrency, hereby leading to the formation of the neckline.
Then the bulls take over the market again, leading to the formation of the second top, only for the bears to dominate again, thus forming the second top.
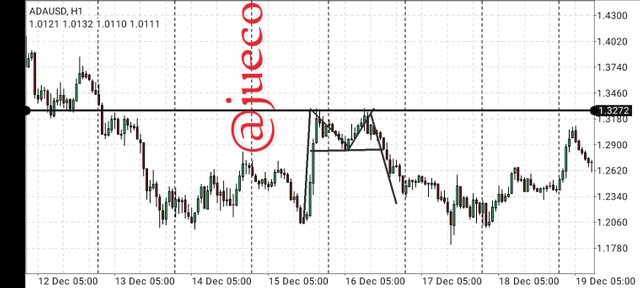
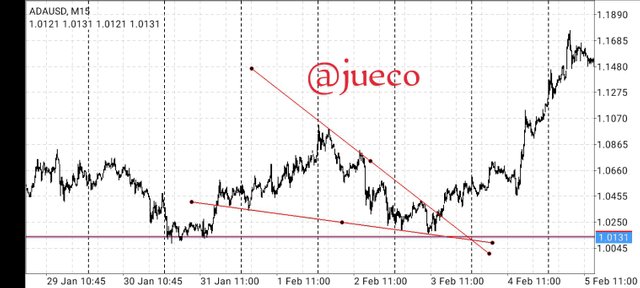
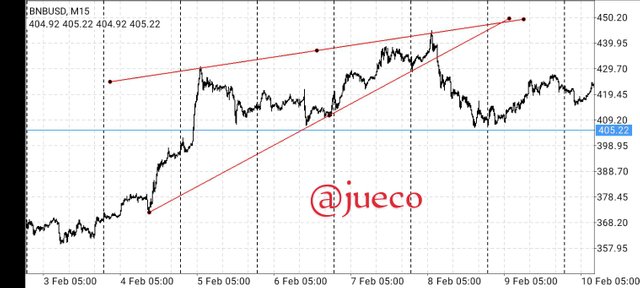
Screenshot from mt4
The above screenshot is a chart of the pair ADAUSD, showing the formation of a double top.
The confirmation signals to enter a double top is usually when the price breaks below the neck line.
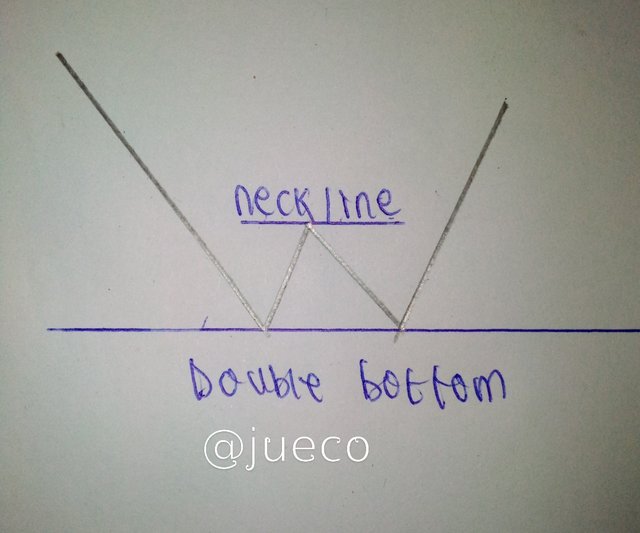
The double bottom is the reverse of the double top.
The double bottom can be explained to be a trend reversal pattern that usually denotes an uptrend, in a word, it can be called a bullish trend reversal pattern.
The double bottom consist of two lows of equal or nearly equal price and a high in between them.
The lows are usually referred to as the double bottom while the high is refered to as the neckline.
Here, unlike the double top, the neckline represents the resistance line and the double bottom represents the support line.
The double bottom is a chart pattern which signifies that the bulls are about to take over the and they can only be confirmed when the price breaks above the neckline.
Whenever the price breaks above the neckline, it usually signifies a good entry criteria.
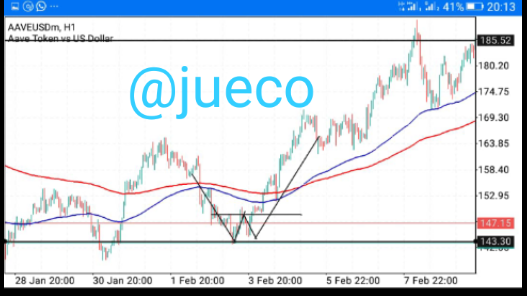
Screenshot from mt4
The above is a screenshot of the chart AAVEUSD, signifying a double bottom.
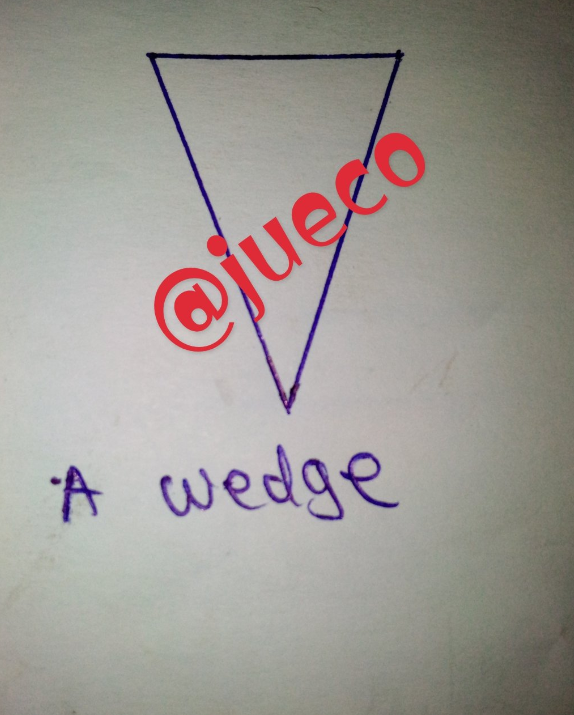
A wedge can be explained to be a trend reversal pattern which consists of the convergence of two trendlines acting as a support and a resistance.
The trendlines of a wedge helps to connect highs and lows on a crypto chart, depending on the type of wedge formed.
A wedge pattern helps to signal either a bearish trend reversal or a bullish trend reversal.
A wedge pattern is characterized by 3 unique features:
The converging trendlines which acts as a support and resistance.
A pattern of decreasing volume as the price approaches the point of convergence of the trendlines.
A breakout from either of the trendlines.
There are two types of wedge pattern:
- The rising wedge
- The falling wedge
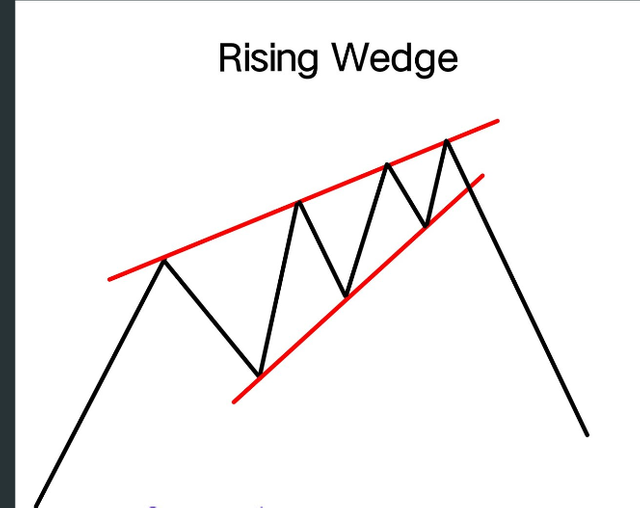
A rising wedge can be explained to be a trend reversal pattern that occurs in a bullish trend, thus signifying a downtrend.
A rising wedge consist of higher highs, higher lows, support line connecting the higher lows and a resistance line connecting the higher highs.
The concept behind the formation of a rising wedge is that there is always a pause during the retrace of prices, in that it fails to get to it's previous low, thus forming a higher low and a decrease in volume.
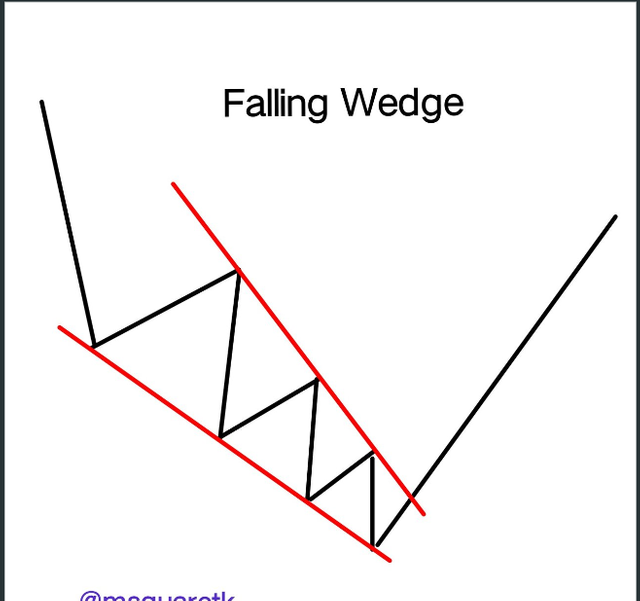
A falling wedge can be explained to be a trend reversal pattern occuring in a bearish trend, thus signaling an uptrend.
It can also be called a bullish trend reversal pattern.
A falling wedge consist of lower lows, lower highs, a support line connecting the lower lows and a resistance line connecting the lower highs.
A falling wedge can give a buy signal when the price of the market breaks it's resistance line.
The concept behind the formation of a falling wedge is that the buyers were not strong enough to drive the price of the commodity to it's previous high, thus forming a lower low and a decrease in volume.
Main differences between the double top and double bottom
Main differences between the double top and double bottom
| DOUBLE TOP | DOUBLE BOTTOM |
|---|---|
| It is usually formed at the end of a bullish trend | It is usually formed at the end of a bearish trend |
| It's neckline acts as a support line and it's tops acts as a strong resistance line | It's neckline acts as a resistance line and it's bottom acts as a support line. |
| It is a reversal pattern that reverses a bullish trend to a bearish trend, in other words, it is a bearish trend reversal pattern | it is a reversal pattern that reverses a bearish trend to a bullish trend, in other words, it is a bullish trend reversal pattern |
| The formation of a double top takes the shape M | The formation of a double bottom takes the shape W |
| The formation of a double top indicates that there is more supply than demand in the market | it's formation indicates that there's more demand than supply in the market |
Screenshot from mt4
The above screenshot is that of a crypto chart indicating a double bottom
Screenshot from mt4
The above screenshot is that of a crypto chart indicating the formation of a double top.
Explain and highlight the main differences between a bullish wedge and a bearish wedge
Explain and highlight the main differences between a bullish wedge and a bearish wedge
A bullish wedge is a chart pattern that consist of the formation of higher highs and higher lows while a bearish wedge is a chart pattern that consists of lower lows and lower highs
A bullish wedge happens to be a bearish trend reversal pattern whenever it is formed in a bullish trend while a bearish wedge happens to be a bullish trend reversal pattern whenever it is formed in a bearish trend.
Whenever a bullish wedge is formed in a bearish trend, it is serving as a bearish continuation pattern while, when a bearish wedge is formed in a bullish trend, it is serving as a bullish continuation pattern.
A bullish wedge is a bearish reversal pattern whereby the price action is expected to break it's support line while a bearish wedge is a bullish reversal pattern where it's price action is expected to break it's resistance line.
The confirmation of a bullish wedge occurs when it's support line has been broken and retested while the confirmation of a bearish wedge occurs when it's resistance has been broken and retested.
Shown below is a good example of a Bullish and bearish wedge
A BULLISH WEDGE FROM MT4
A BEARISH WEDGE FROM MT4
Explain the volatility that usually exists with respect to the volume in the wedges. When is there usually more volume? What happens if the pullback breaks the support of a wedge
Explain the volatility that usually exists with respect to the volume in the wedges. When is there usually more volume? What happens if the pullback breaks the support of a wedge
As discussed earlier, a rising wedge can act as both a bearish reversal pattern and a bearish continuation pattern, depending on its location of formation.
This means that if a bullish wedge is formed at the peak of an uptrend,it is signifying a trend reversal and if it appears in a downtrend, it signifies a trend continuation.
A rising wedge is usually formed due to a purse in the market, and from the formation of a rising, the volume of the market will be low.
Then immediately after the formation of a rising wedge, the volume of the market increases drastically.
In a nutshell, there's more volume after the formation of the rising wedge, and when the resistance of the rising wedge is broken, it experiences a sharp downward move, thus increasing it's volume and momentum.
A falling wedge as we know is a bullish trend reversal pattern when it is formed in a bearish trend and a trend continuation when it is formed in a bullish trend.
A falling wedge comprises of a sharp end, two trendlines connecting the lower lows and lower highs of the price.
In a falling wedge, the volume is always low from the beginning to the end of the wedge.
Then after the formation of the wedge, there's a surge increase in volume and momentum, forming ba great increase in price of the commodity.
Find and analyse the double top pattern on at least 2 charts
Find and analyse the double top pattern on at least 2 charts
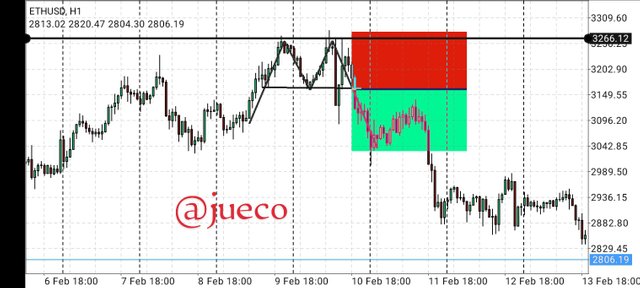
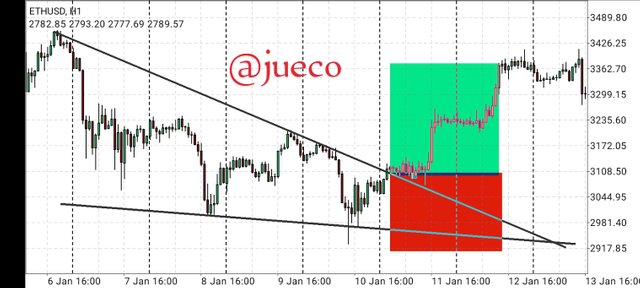
SCREENSHOT FROM MT4
The above screenshot is a chart of the pair ETHUSD in a 1hour time frame.
As seen above, the chart began with an uptrend, comprising of higher highs and higher lows, which led to the formation of it's first top, then it hits a resistance which pushes it's Price downward, leading to the formation of it's neck line, when it got to it's neckline, it encountered a strong support which rejected it's price upward, making a retrace back to it's initial resistance, thus forming its second top.
After the formation of it's second top, it's hits the strong resistance again and retraced backwards to it's Support level.
The point where it breaks it's support level signals a good sell order, and a wise trader will make a good use of the signal.
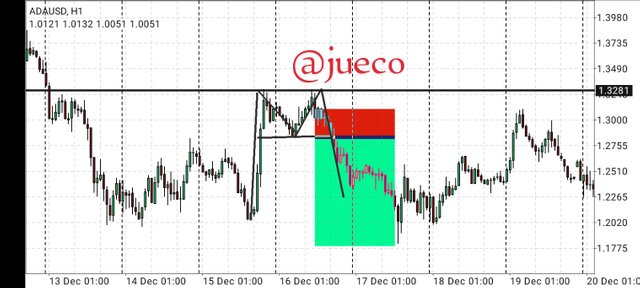
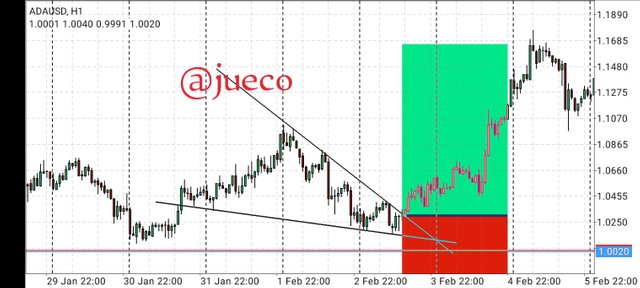
Screenshot from mt4
The above screenshot is a chart of the pair ADAUSD in a 1hour time frame.
From my chart, I noticed the chart form higher highs and higher lows which led to the formation of it's peak price.
When it got to it's peak price, I noticed that it encountered a strong resistance and retraced backwards, then it hits a strong support which is at its neckline, and then retraced back to it's resistance.
Again, it's price was rejected by the resistance line and then it retraced downward with a force and it's support line.
The point where it broke it support line is a good entry criteria and a wise trader will place a sell order, just as illustrated above.
Find and analyse at least 2 rising wedge and 2 falling wedge on at least 2 charts
Find and analyse at least 2 rising wedge and 2 falling wedge on at least 2 charts
As we know, a rising wedge is characterized by higher highs and higher lows, it also consists of two trendlines connecting it's higher lows and higher highs.
This is illustrated below
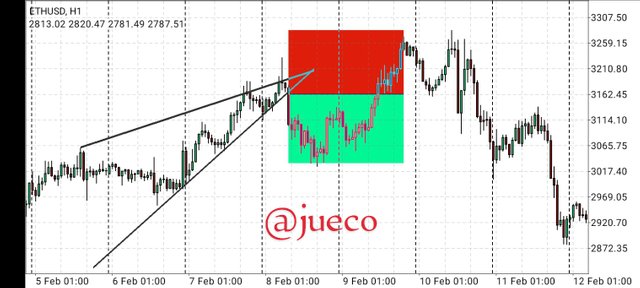
Screenshot from mt4
The screenshot above shows the pair of ETHUSD in a one hour frame.
And as seen above, the chart consist of higher lows and higher highs and these are connected by trendlines.
I then waited for the price to break below its support line, when it did, I took it as a good entry position to place my sell order.
It is well known, that for a rising wedge, the price is expected to break it's support line and forming higher lows and higher highs, alongside va decrease in volume.
This is also indicated below.

Screenshot from mt4
The above screenshot is a rising wedge on the chart ADAUSD, and my entry position was placed when the price breaks below its support line.
A falling wedge is a bullish trend reversal pattern that is characterized by lower lows and lower highs.
SCREENSHOT FROM MT4
The screenshot above shows a falling wedge of the chart ETHUSD in a one hour time frame.
As it is seen above, the chart comprises of lower highs and lower lows which is connected by the resistance and support lines.
I watched and waited for the price to break it's resistance line, after it did, I took it as a great signal to place my buy order.
As expected, the resistance line of a falling wedge is to be broken inorder for it to be confirmed as a falling price.
This is illustrated below
Screenshot from mt4
Importance of patterns in technical trading
Importance of patterns in technical trading
There exists several types of patterns in trading, and their importance cannot be overemphasize.
Patterns are very useful in trading as they perform the following;
Patterns helps traders to determine the next price action of a cryptocurrency.
Chart patterns, when analysed properly, helps a trader to make wise decision on when to enter and exit a market, it also helps them set stop loss and take profit wisely.
Patterns bare highly compatible with other technical analysis tools and this helps to minimize loss when trading.
The understanding of patterns also helps a trader filter out false signals from a chart and thus increase his success rate.
Do you find it effective to use these patterns in trading?
Do you find it effective to use these patterns in trading?
The use of double top, double bottom, and wedges in trading is an effective way to produce fruitful results in technical analysis.
Although, 100% success rate is not guaranteed in trading irrespective of the tool used, but from research and experience, chart patterns is considered to be effective for trading.
There are many patterns that have proven to be effective in trading, in that, when they are seen on a chart by analyst, the analyst won't think twice before executing an order based on that signal. Such patterns include triangle pattern, flag pattern, head and shoulder, etc.
Also, unlike other technical tools that gives different results when analysed on different time frame, chart patterns givea the same analysis when analysed on a multi time frame.
In a nutshell, I agree that it is effective to use these patterns in trading.
Conclusions
Conclusions
Double top and double bottom is a good trend reversal pattern that shows that the chart is about to move in the opposite direction.
The double top takes the shape of M when formed an the double bottom takes the shape of W when formed, and they're all effective charts pattern.
I appreciate Prof @imagen for this thoughtful lecture, I look forward to your next lecture Prof.
Gracias por participar en la Sexta Temporada de la Steemit Crypto Academy.
Espero seguir corrigiendo tus futuras asignaciones, un saludo.
Hello Prof @imagen, in no attempt to disturb you but my post is 5days old without the visit of steemcurator02.
This is an unusual scenario and I'm worried, kindly help me get the attention of the steemit team, thank you
Hello Prof @imagen, in no attempt to disturb you but my post is 6days old without the visit of @steemcurator02.
This is an unusual scenario and I'm worried, kindly help me get the attention of the steemit team, thank you