Double Top and Wedge Trading - Crypto Academy S6W2 - Homework Post for @image

Cover Page designed by me, @msquaretk | designed with imarkup app
It's another week in the Crypto Academy. This is the week 2 of the season 6. Thanks to all our Professors and the Admins for a job well-done in the week 1. This post is written in response to Professor @imagen 's assignment. He gave us some questions after his lecture on "Trading with Double Top and Wedges.". I will be responding to his questions one after the other. Follow me closely.

1. Explain in your own words the concept of Double Top, Double Bottom and Wedges. How to interpret each one?
In this first task, I am going to be be explaining the concept of double top, double bottom and wedges and how to interpret them. Let's start with double top.
Double Top
Double Top is a chart pattern which usually forms at the extreme peak high of the uptrend. It is also reffered to as double roof. It is a reversal pattern which in an uptrend. The word double in its name means that there are two tops are formed at the peak.

Image created with imarkup app
Double tops signifies a resistance level where price could not have a chance to proceed further. We know that resistance level resist the price to the downside.
The interpretation of the double top is that the buyers are in the control of the price when the first top formed as there will be a high momentum to the upside. The price then meets an obstacle called resistance. Sellers take over the price and drags the price downward, but shortly after some downward movement of price, the buyers take over again.
The buyers resume the market and put more effort so as to see the price rise above the first top. But unfortunately, buyers could not go beyond the first top and price makes the second top at the same level of the first top forming the second top.
Then, sellers finally takes over the market. A better entry will be made at after the price breaks the neckline and retest.
Double Bottom
Double bottom is a chart pattern which usually forms at the extreme bottom of a downtrend. It is a bullish reversal pattern which is found at the bottom of a downtrend. The word double in its name means that there are two bottoms formed at the extreme bottom.

Image created with imarkup app
Double tops signifies a support level where price could not have a chance to proceed further. We know that support level is a place where buyers are concentrated to demand for the asset and accumulate more of the asset.
The interpretation of the double bottom is that the sellers are in control of price when the first bottom formed as there will be a high momentum to the downside. The price then meets an obstacle called support. Buyers take over the price and drags the price upward for some moments, but shortly after some upward movement of price, the sellers take over again.
The sellers resume the market and put more effort so as to see the price fall below the first bottom. But unfortunately, sellers could not go beyond the first bottom and price makes the second bottom at the same level of the first bottom.
Then, buyers finally takes over the market. A better entry will be made after the price breaks the neckline to the upward and retest.
Wedge
Another important chart pattern is wedge. A wedge pattern is also a reversal pattern which forms during a consolidation in the market. A wedge is constructed on the chart by two trendlines converging and yet moving in the same direction, either downward or upward.
There are two types of wedges, rising and falling wedge.
A rising wedge is a wedge in which price is expected to break to the downside at the end of the wedge pattern. The two trendlines of a rising wedge converge to the upside in the same direction. Price breaks to the downside when the sellers take over the market and drags the price to the downside. In the screenshot below, you will see an example of a rising wedge.

Image created with imarkup app
The interpretation of a rising wedge is that, the price of an asset undergoes a pause during the pull back in a bearish market. During this moment, the volume will be greatly reduced until a breakout is occurred and the price continues its bearish movement.
A falling wedge is a wedge in which price is expected to break to the upside at the end of the wedge pattern. The two trendlines of a falling wedge converge to the downside in the same direction. Price breaks to the upside when the buyers take over the market and drags the price to the upside. An example of a falling wedge is the screenshot below.
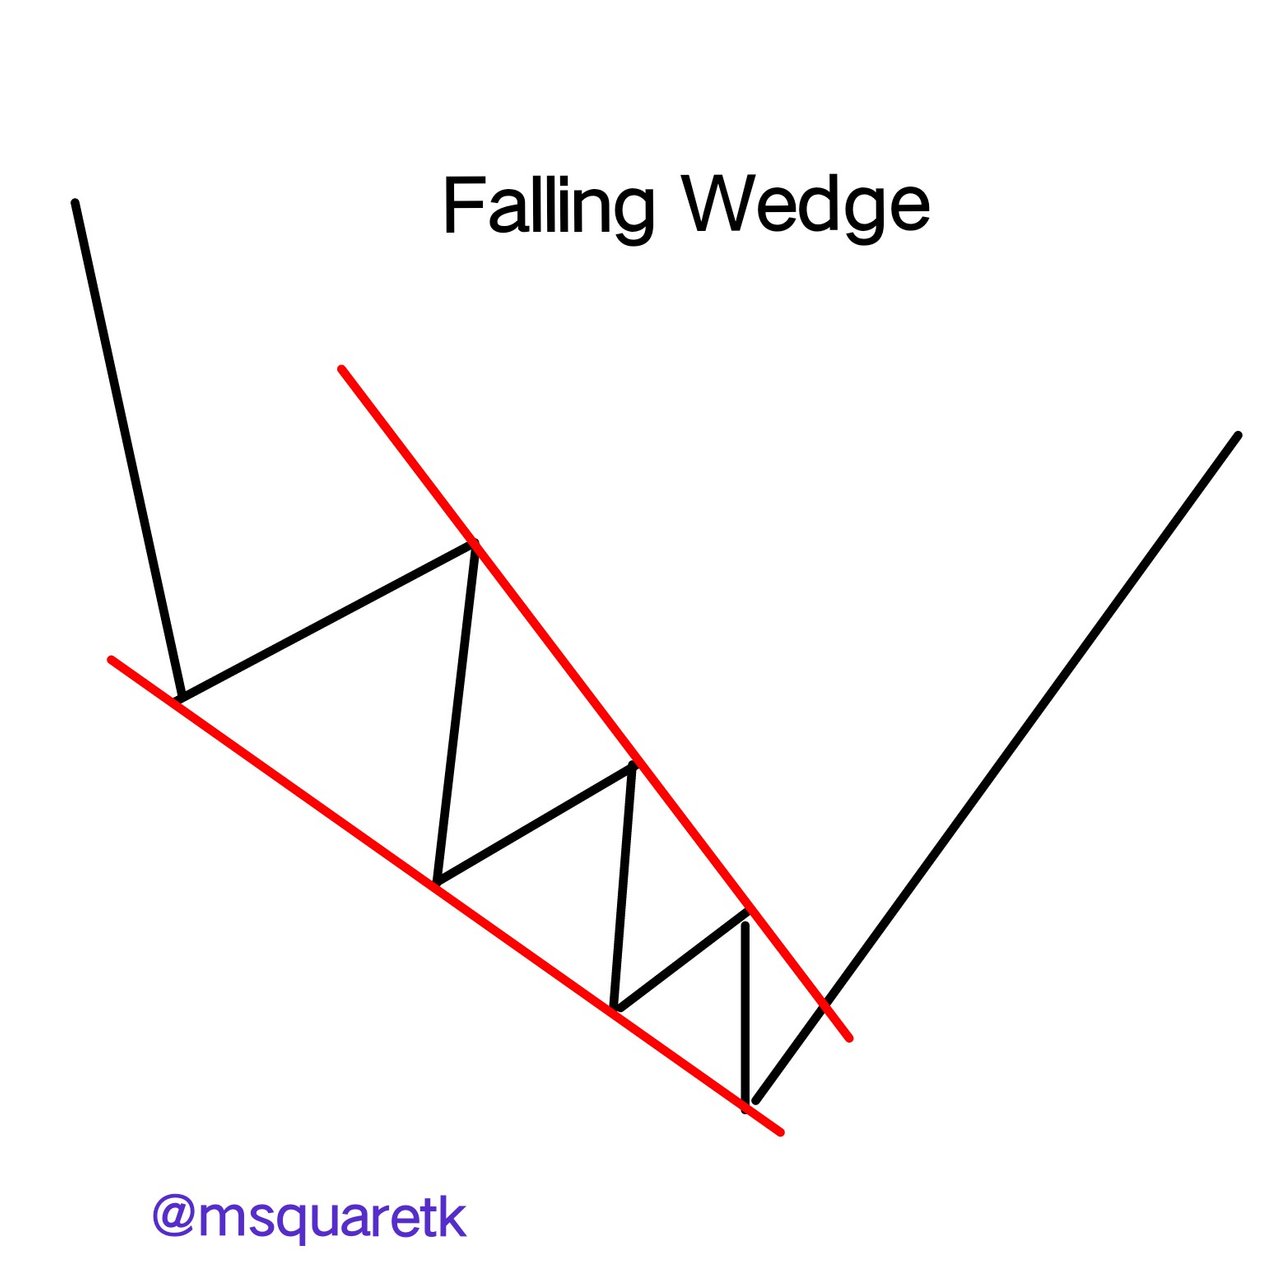
Image created with imarkup app
The interpretation of a falling wedge is that, the price of an asset undergoes a pause during the pull back in a bullish market. During this moment, the volume will be greatly reduced until a breakout is occurred and the price continues its bullish movement.
2. Main differences between the Double Top and the Double Bottom. Show screenshots
In this part of the task, I am going to be showing the difference between double top and double bottom.
Double top is a pattern that forms at the extreme peak of an uptrend, whereas, top bottom forms at the extreme bottom of a downtrend.
Double top is a bearish reversal pattern, meaning it changes a bullish trend to a bearish trend. Double bottom is a bullish reversal pattern, meaning it has capacity to change a bearish trend to a bullish trend. As it will be seen in the screenshot below, double top changed the trend from a bullish to a bearish and double bottom changed a bearish trend to a bullish trend.
Double top forms a shape like M while double bottom forms a shape like W. In essence, if you see a shape like M in an uptrend, you should know that that's a double top and if you see a shape like W in a downtrend, that's a double bottom.

Screenshot from MT4 app
In the screenshot above, a double top was formed on the chart XPRUSD and we could see how a bullish trend turned to a bearish as a result of that pattern.
An example of a double bottom is shown in the screenshot below.

Screenshot from MT4 app
We can see that a double bottom was formed on the chart of XRPUSD at the extreme bottom of a bearish trend. That pattern reversed a bearish trend and a bullish trend began to form in which buyers took over the market.
3. Explain and highlight the main differences between a bullish wedge and a bearish wedge. Show screenshots of each
In this part of the task, I am going to be showing up the difference between rising and falling wedges.
A Rising wedge is a bearish reversal pattern when formed in an uptrend and it's a bearish continuation pattern when formed in a bearish trend. While a falling wedge is a bullish reversal pattern when formed in a downtrend and it's a bullish continuation pattern when formed in a bullish trend.
A rising wedge is constructed by drawing two trendlines at the highs and lows of the price during a pause in the market. The two trendlines are seen converging in the same direction, upward direction. While a falling wedge is constructed by drawing two trendlines at the highs and lows of the price; the two trendlines are seen on the chart converging in the same downward direction.
An example of a rising wedge is attached below. You will see that this type of rising wedge is a bearish continuation pattern. See the screenshot below.

Screenshot from MT4 app
Also, an example of a falling wedge is attached below. This type of a falling wedge is a bullish continuation pattern. See the screenshot below.

Screenshot from MT4 app
4. Explain the volatility that usually exists with respect to the volume in the wedges. When is there usually more volume? What happens if a pullback breaks the support of a wedge?
In this part of the task, I am going to be explaining the volatility that exists with respect to the volume in the wedges. As I have explained earlier, we have two types of wedges, rising and falling wedges.
A rising wedge can be a reversal pattern or continuation pattern. When it's formed at the extreme peak of an uptrend, it's a reversal pattern but when it's formed at the middle of a bearish trend, it's a bearish continuation pattern.
It's pertinent to know that a rising wedge forms during a pause in the market. That's, it's usually formed during a pull back in the market. Prior to its formation in an uptrend, buyers move the price of an asset with a very great momentum and also in a downtrend prior to the formation of this pattern, sellers move the price downward with a great momentum. Then the price then goes to a period of pause in which there's no momentum.
During the formation of a rising wedge there's little or no momentum as price doesn't show move very fast. The volume is very low during this period. From the start of the formation to the end, volume will be seen decreasing. But as soon as the price breaks the lower trend line, the volume will increase and the momentum will be shifted to the downside. In essence, volume decreases during the formation of a rising wedge and increases after the break of the wedge.
A falling wedge can be a reversal pattern or continuation pattern. When it's formed at the extreme bottom of a downtrend, it's a reversal pattern but when it's formed at the middle of a bullish trend, it's a bullish continuation pattern.
A falling wedge forms during a pause in the market. That's, it's usually formed during a pull back in the market. Prior to its formation in a downtrend, sellers move the price of an asset with a very great momentum; and also in a downtrend prior to the formation of this pattern, buyers move the price upward with a great momentum. Then the price then goes to a period of pause in which there's no momentum.
During the formation of a falling wedge there's little or no momentum as price doesn't move very fast. The volume is very low during this period. From the start of the formation to the end, volume is seen decreasing. But as soon as the price breaks the upper trend line, the volume will increase and the momentum will be shifted to the upside. **In essence, volume decreases during the formation of a rising wedge and increases after the break of the upper trend line (resistance) of the wedge **.
5. Find and analyze the double top pattern on at least 2 charts. Show your own screenshots
In this task, I'm going to be showing two top tops and analyse them on two different crypto pairs.
Double Top on the Chart of XRPUSD
The first chart i wil be showing an example of a double top is XRPUSD. On the chart of XRPUSD, H1 timeframe, the market is seen in an uptrend with a series of higher highs and higher lows which signifies that the buyers during this time were pushing the price with a very great momentum.
The price in an uptrend then met a resistance which pushed the price downward. This created the first top. Then the buyers resumed back and pushed the price again to the upside, but they were unable to put it beyond the first top, then sellers took control of the market , his is the second top. See the screenshot below.

Screenshot from MT4 app
As soon as the sellers take control, they were able to break the last low created signifying a break of market structure. A better entry would be taken a the break of this low (or neckline) or at the retest of it. A stop loss would be placed half the way of the double top and the low and take profit is the distance between the double top and the neckline as measured I the screenshot.
Double Top on the chart of ADAUSD
The second double top I will be analysis is on the chart of ADAUSD. The price is seen on a downtrend. But a pull back which created a mini uptrend formed. As the price kept making a high highs and higher lows, meaning that the buyers were in control for a short time, it got to a resistance level where the price reversed and that made the first top.
Then, sellers took control of the market and the price experienced a little decline. But buyers wanted to push the price high, so they resumed the market but unfortunately they got stopped at the level of the first top. This created the second top. The sellers then took control of the market and broke the last low created. See the screenshot below.

Screenshot from MT4 app
The best time to make a sell entry is at the break of the neckline or when the price retest. The stop loss is placed above the low, a halfway to the double top. The take profit is the distance between the double top and the neckline.
6. Find and analyze at least 2 rising wedges and 2 falling wedges on at least 2 charts. Show your own screenshots.
In this task, I am going to be analysing the wedges found on two crypto pairs. I will be using the chart of XRPUSD and LTCUSD, H1 timeframe.
Rising Wedges on the Chart of XRPUSD and LTCUSD
Like I discussed earlier, a rising wedge can be a reversal pattern or a continuation pattern. It's constructed by drawing two trendlines at the highs and lows of price during a pull back.
On the chart of XRPUSD and LTCUSD, H1 timeframe, the price was seen in a downtrend. And after a considerable fall in price of these assets, they underwent a period of pull back. The pull backs lead to the chart pattern called rising wedge in which the momentum and volume was decreasing.
As you will see in the screenshots below, the trendlines were drawn to indicate the wedges by connecting the low and highs of the price together.

Screenshot from MT4 app

Screenshot from MT4 app
Then, the price is expected to break below the lower trendline which acts as the support during the pull back. As soon as the price breaks the lower trendline (the wedge), then a sell position could be taken. A sell entry is made immediately at the break of the wedge, stop loss is placed at the last high created before the break of the wedge. Take profit is the length of the last impulsive move as seen in the screenshot above.
Falling Wedges on the Chart of XRPUSD and LTCUSD
Falling wedge can also be a reversal pattern or a continuation pattern depending where it forms. If it forms in an uptrend, it's reffered to as a continuation pattern and if it's at the bottom of a downtrend, it's a reversal pattern.
On the chart of XRPUSD and LTCUSD, H1 timeframe, the price was seen in an uptrend. And after a considerable rise in price of these assets, they underwent a period of pull back. The pull backs led to the chart pattern called falling wedge in which the momentum and volume was decreasing.
In the screenshots below you will see that the trendlines were drawn to indicate the wedges by connecting the lows and highs of the price together.

Screenshot from MT4 app

Screenshot from MT4 app
The price is expected to break above the upper trendline which acts as the resistance during the pull back. As soon as the price breaks the upper trendline (the wedge), then a buy position could be taken. A buy entry is made immediately at the break of the wedge, stop loss is placed at the last low created before the break of the wedge. Take profit is the length of the last impulsive move as seen in the screenshot above.
7. Importance of patterns in technical trading.
Patterns are very important in technical analysis. There are two types of kinds of pattern: candlestick pattern and chart pattern.
Candlestick patterns are patterns which are made up of just a single or two or three candles. Candlesticks patterns are used to take entry in the market. Examples of candlestick patterns are, morning star, hammer, hanging man, shooting star etc.
Chart patterns are patterns which are made of many candlesticks. Chart patterns are usually indicated by drawing tools such as trendlines, horizontal lines, etc. Examples of chart patterns are, double top, double bottom, rising wedge, falling wedge, Headed and shoulder pattern etc.
Patterns are useful in technical trading. Traders look at the chart for these patterns because of their usefulness. Some patterns are used to take entry position in the market. Some candlestick patterns when formed on the support or resistance level are capable of resisting or supporting the price. Hence traders use them to enter either sell or buy position depending on where they form.
Patterns help traders to know point or reversal or continuation of trend in the market. One of the things traders look out for when they open the chart is to know which trend to join. They will want to know whether the current trend is healthy to trade or will soon come to an end. So, by looking at the patterns being formed on the chart, they will know if they should wait or join the trend. Some patterns are reversal pattern and some are continuation pattern.
It's not enough to know when to enter a trade, it's also important to know when to exit the market. Patterns help traders to know point of exit and thereby reducing their risk. Traders are using chart pattern to set the take profit and Stochastic loss for their entry. This help them to be able to know when they need to vacate the market.
The use of pattern help reduce guess work. This is another important of pattern in technical analysis. Because of the nature of the market, it's believed that patterns which have formed in the past will repeat. So traders take advantage of this and take position when they see the pattern form.
In addition, patterns are combined with other technical tools like indicators to increase the success rate of the analysis. Some patterns work well with the technical indicators.
8. Do you find it effective to use these patterns in trading? Justify your answer
Yes! Patterns are very effective in trading. Although, it should be noted that no tool has 100% success rate. Meaning, sometimes the pattern can also give false signals. But according to the use of chart patterns according to research, it is said that generally chart pattern have a good success rate.
There are some patterns which have as high as 85% success rate. These types of pattern when formed on the chart, traders don't think twice before they decide to place position in the market. For example, head and shoulder pattern is one of the examples of a chart pattern which traders look for on the chart. Head and shoulder pattern is a reversal pattern which is usually formed at extreme peak point of an uptrend.
Further, patterns are formed by price itself. Hence they are price action based. We know that price action shows the historical behavior of traders over some period. So, emotions and psychology of traders are reflected on the chart which forms what's known as patterns on the chart which can be studied and use to place position in the market.
Let's see an example of head and shoulder pattern below. It's one of the reliable and effective chart pattern. It's a bearish reversal pattern which traders look for on the chart.

Screenshot from MT4 app
The screenshot below shows another head and shoulder pattern on the chart of TRXUSD. We will see how the price reversed to the downside when this pattern formed at the extreme peak of an uptrend.

Screenshot from MT4 app
In addition, patterns can be used and are effective on any timeframe. Unlike signals given by technical indicators which may not be effective on all time frames, patterns can actually be used on any timeframe.
9. Conclusion
Technical analysis involves the use of technical tools such as chart patterns, candlestick pattern, drawing tools, etc on he price graph or chart to predict the direction of price. In this task, I have covered the of the chart patterns which are very important which traders use to analyze the behavior of he market. Double Top and bottom, rising and falling wedges are important tools in technical trading.
Technical indicators can be combined with patterns to increase the success rate of the analysis. For example, relative strength index (RSI) can be combined with double top and bottom and volume indicator can be combined with rising and falling wedges.
Thanks to Professor @imagen for bringing this course up. I have learnt one or two things from the course. I look forward to seeing your next lecture.
CC: @imagen
Written by @msquaretk
Gracias por participar en la Sexta Temporada de la Steemit Crypto Academy.
Espero seguir corrigiendo tus próximas asignaciones, saludos.