Trading with wedge pattern- Crypto Academy/S5W5- Homework post for @sachin08

Hello crypto minded friends,
It is a pleasure to welcome you to my assignment post of the season 5 week 5 of the steemit crypto academy, and I believe that we have all been enjoying this season, continue to enjoy!
This week, we shall be learning from Prof @sachin08 on the topic " Trading using wedge pattern".
Please follow along as we begin our exploration on this topic.
EXPLAIN WEDGE PATTERN IN YOUR OWN WORDS
EXPLAIN WEDGE PATTERN IN YOUR OWN WORDS
Agreeable, from the lessons learnt from Prof @sachin08, we have come to understand that there are several trading patterns used to analyze and predict the next movement of price in the market.
Amongst them are triangular pattern, flag pattern, rectangle pattern and the most frequently used; wedge pattern.
From our mechanical terms, a wedge is a device that is made of wood or metal and possess two ends in which one is very thin and sharp and the other is wide.
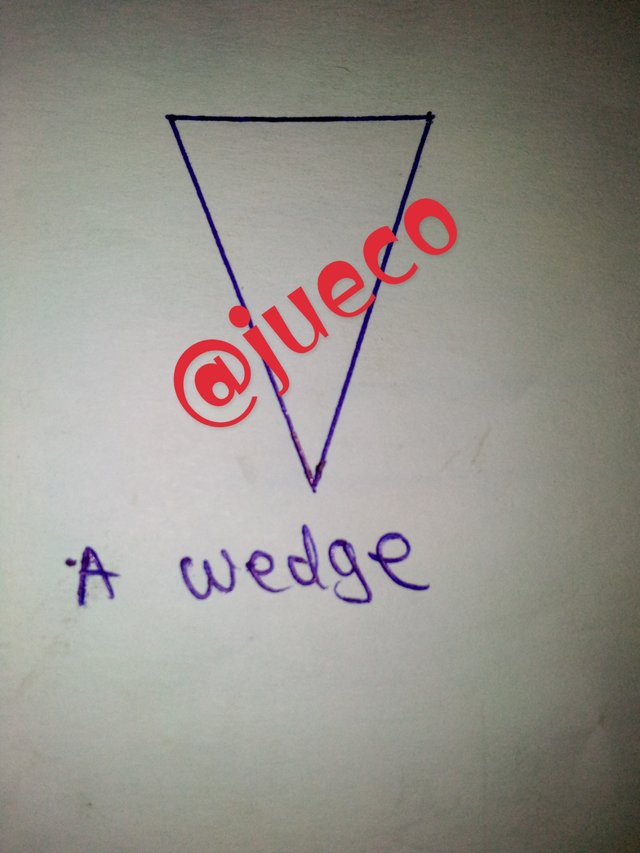
Image formed by me
A wedge is usually triangular in shape and is used for splitting materials.
In the cryptoworld, a wedge is a price pattern that is formed by the convergence of trend lines on a chart.
This trading pattern is refered to as a wedge pattern because of the image formed after the convergence of the trendlines, the image formed usually brings the thought of a wedge to mind.
A wedge pattern can be described to be a triangular shaped pattern that joins highs and lows of price in a price chart.
A wedge pattern is usually characterized by a very thin end and a wide base just like the shape of a triangle.
The trendlines formed by a wedge pattern either indicate a falling wedge or a rising wedge which will later be explained in the course of this adventure.
A wedge pattern being the convergence of two trendlines, the upper trendline and the lower trendline, has the upper trendline acting as a dynamic resistance and the lower trendline acting as a dynamic support.
From the view point of technical analyst, wedge pattern act as potential trend reversal when it is formed at the end of a bullish trend.
EXPLAIN BOTH TYPES OF WEDGES AND HOW TO IDENTIFY THEM IN DETAIL [SCREENSHOT REQUIRED]
EXPLAIN BOTH TYPES OF WEDGES AND HOW TO IDENTIFY THEM IN DETAIL [SCREENSHOT REQUIRED]
Recall, I made mention of a rising wedge and a falling wedge, and I promised that it will be explained as we proceed.
There exists two types of wedge pattern, the rising wedge and the falling wedge.
RISING WEDGE
A rising wedge is a trade pattern that is usually formed when the price of a commodity has been experiencing a bullish trend over a period of time, although it can also be found between a downtrend also, but seldomly.
A rising wedge pattern shows that there's a high probability that price of a commodity will depreciate once there is a breakout of the support line.
This point of breakout is a good spot to take profit by selling off assets as the price tends to reduce, inorder for one to buy again.
A rising wedge is view as a bearish pattern because it's occurrence usually indicate a price reversal, which is a downward trend.
A rising wedge, being a trade pattern that is usually formed at the end of an uptrend is characterized by the connection of higher highs and lower highs, and this trendline converges to form a sharp apex.
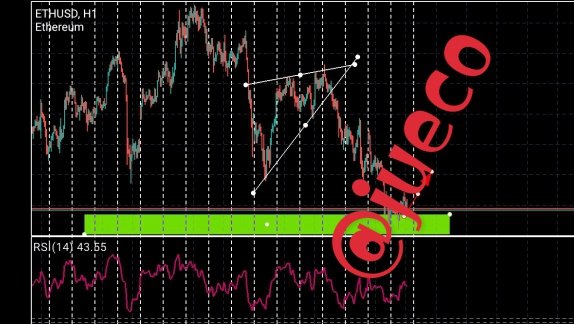
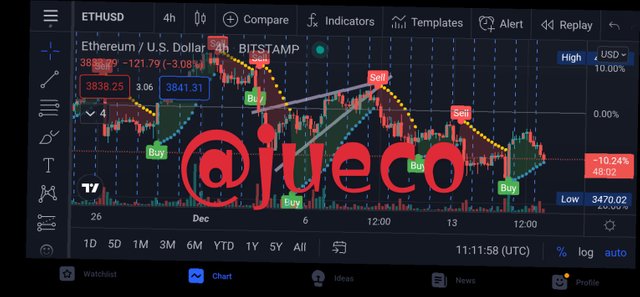
SCREENSHOT FROM MT5
The screenshot above shows a rising wedge on the chart, and as seen, it is characterized by the connection of higher highs and lower highs.
And when the price experienced a breakout on the resistance line, it was followed by a bearish move.
IDENTIFICATION OF A RISING WEDGE
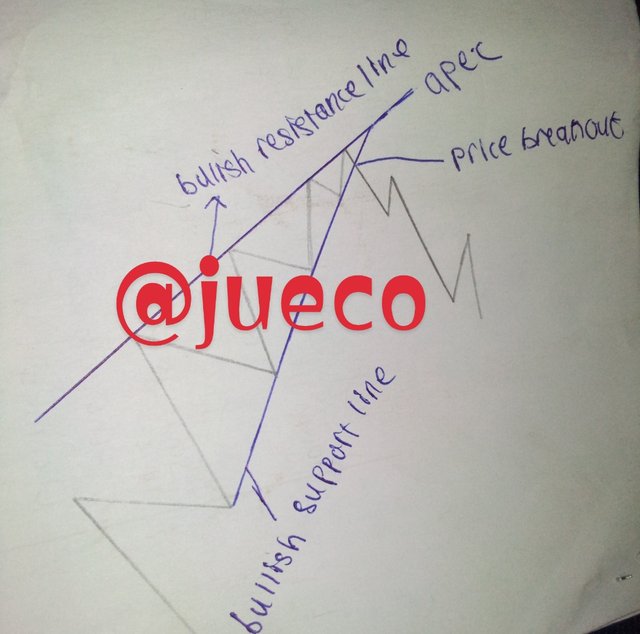
IMAGE FORMED BY ME
A rising wedge can be identified through the following:
A rising wedge is characterized by two trendlines, the resistance trendline connecting higher highs on the chart and the support line connecting lower lows. Once this has been identified, let's proceed
A wedge pattern consist of an apex which is formed by the convergence of the trendlines, and it is usually located on the upper side of the chart, this needs to be observed too.
The trendlines of the wedge pattern must connect at least three points of the higher highs and lower highs on the chart
Also watch out for decreasing volume because a rising wedge is characterized by decreasing volume
And finally, once there's a price breakout on the resistance trendline, it is followed by a bearish move.
FALLING WEDGE
Falling wedge is antonymic to rising wedge, in the sense that rising wedge is the convergence of bullish trend lines while falling wedge is the convergence of bearish trendline.
Falling wedge is a trading pattern that is usually formed when a commodity is experiencing a bearish move and it usually appears to signify the end of the bearish move.
The formation of a falling wedge signifies that there is a high chance that the current market trend (bearish trend) will experience a trend reversal, which indicates the formation of a bullish trend.
The strategy of a falling wedge is a very good signal to enter the market because once there's a price breakout on the support line, it will be followed by a bullish move.
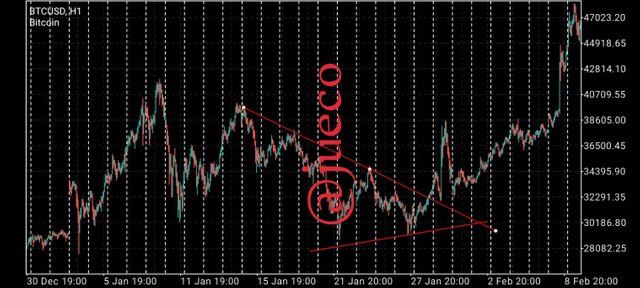
SCREENSHOT FROM MT5
The above uploaded screenshot shows a falling wedge which is characterized by the formation of two trendlines lines on a bullish market.
IDENTIFICATION OF FALLING WEDGE
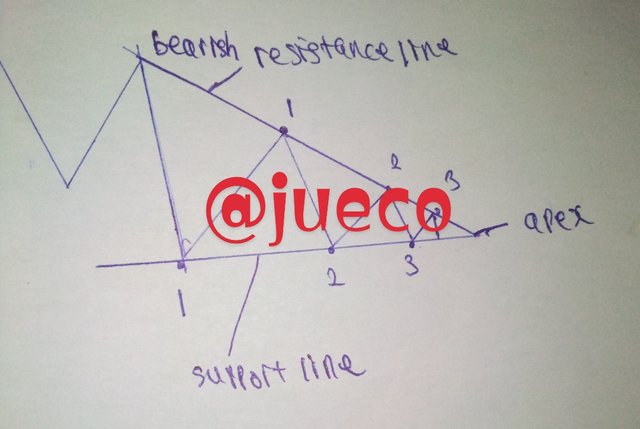
IMAGE FORMED BY ME
A falling wedge can be identified by the following:
A falling wedge is usually found at the end of a bearish market
It is consist of two trendlines, the upper bearish line which act as the resistance line and the lower trendline which act as the support line
The trendlines must connect at least two or three points on the chart
A falling wedge is also characterized by a decreasing volume, it's volume decreases as it approaches the appex.
Also note that the falling wedge is formed by the intersection of the two trendlines
DO THE BREAKOUT OF THESE WEDGE PATTERN PRODUCE FALSE SIGNALS SOMETIMES? IF YES, EXPLAIN HOW TO FILTER OUT THESE FALSE SIGNALS
DO THE BREAKOUT OF THESE WEDGE PATTERN PRODUCE FALSE SIGNALS SOMETIMES? IF YES, EXPLAIN HOW TO FILTER OUT THESE FALSE SIGNALS
No trading pattern is known to be perfect at giving signals, many atimes, they give out false signals and this is true of wedge pattern also
And when this false signal is not properly filtered, it can lead to the misunderstanding of the market's condition.
In providing answer to the above asked question, I will say that yes, the breakout of these patterns produce false signals.
As advised, when trading and analysing a market condition, a trader should make use of more than one analysis tool.
There are many technical analysis tools that can be used alongside the wedge pattern.
A very good example is the use of technical Indicators, the use of at least two technical Indicators will filter out these false signals and increase the chances of making profit over every trade.
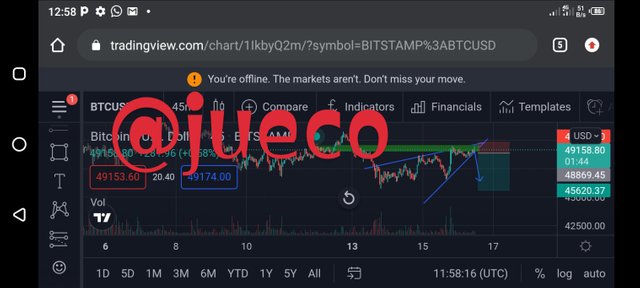
SCREENSHOT FROM TRADING VIEW
The screenshot above is a chart of ETH/USD and as seen above, I made use of a parabolic sar to confirm the breakout given by the wedge pattern.
If you observe, you will notice that there is a false breakout of two candlestick which was filtered out by the technical Indicator.
Without the use of the parabolic sar, I would have easily assumed that is a good selling point and that would have led me to trade which I will later regret.
Indeed to filter out a false breakout, one needs to make use of technical indicators.
SHOW A FULL TRADE SET-UP USING THIS PATTERN FOR BOTH TYPES OF WEDGES ( ENTRY POINT, TAKE PROFIT, STOP LOSS, BREAKOUT)
SHOW A FULL TRADE SET-UP USING THIS PATTERN FOR BOTH TYPES OF WEDGES ( ENTRY POINT, TAKE PROFIT, STOP LOSS, BREAKOUT)
RISING WEDGE
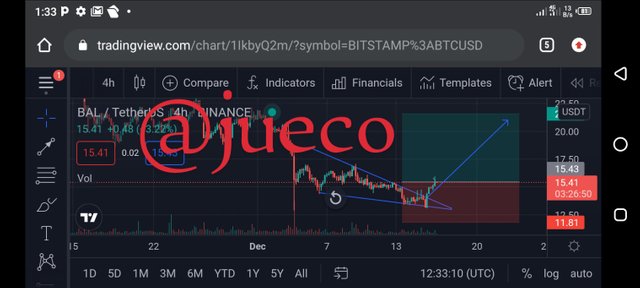
SCREENSHOT FROM TRADING VIEW
From my above shown screenshot, we can see a full trade set up for rising wedge. We can see the continuous fluctuation of the market's price in-between the wedge.
We can also see that the trendlines connected at least two points each of the price .
As seen above, my entry order was placed immediately after the price outbreak on the support trendline and my stop loss was placed a little above the resistance trendline.
My take profit was also carefully placed below the support trendline, because I expect the price of the market to fall beyond that point.
FALLING WEDGE
Screenshot from Trading view
From my above uploaded screenshot, we can see the full trade set-up of a falling wedge. We can see the continuous fluctuation of the candles within the wedge until it broke out from the resistance line, and from there I began my entries.
I placed my stop loss below the support trendline and my take profit was placed above the resistance trendline.
From my Analysis, I expect the price to really move upwards.
CONCLUSION
CONCLUSION
The wedge pattern is of two types, the falling and rising wedge.
And this patterns can be used to give accurate results if it is used alongside technical Indicators.
I appreciate Prof @sachin08 for his wonderful lecture, I look forward to your next lecture Prof.
Hello Prof @sachin08, i am happy to inform you that the trade set-up I made, played out according to plan
Screenshot from trading view
Thanks once more
Great!