[Crypto Trading With Average True Range (ATR) Indicator]- Crypto Academy /S5W1-Homework Post for kouba01


1.) Discuss your understanding of the ATR indicator and how it is calculated? Give a clear example of calculation
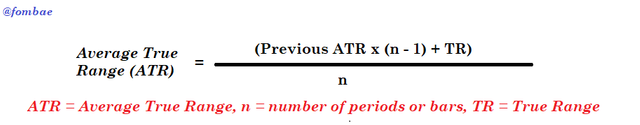
Average True Range (ATR) measures volatility and puts into consideration any gap in the price movement over a specific period. It was introduced by a market technician, J.Welles Wilder's Jr in his book New Concepts in Technical Trading System as the average of true range over the specific period. The default period for ATR calculations is 14 periods, which can be modified (daily, weekly or monthly)depending on the treader strategy. When measuring recent volatility, use smaller periods ranging from 2 to 14 to have a shorter average. For long-term volatility, use a longer average like 20 to 50 periods.
What to look at when working with ATR indicators
When the ART indicator is expanding, the volatility in the market starts increasing, making the ranges of each bar get larger. When the ART moves up while the price in a reversal movement shows strength in the movement by the indicator. The expansion of an ATR indicator is not directional, meaning it can indicate buying or selling pressure in the market. Sharp advances of decline are a result of high ATR values which will hardly be sustained over a long period.
Low ATR values are found during extended sideways price actions and indicate a series of periods in small ranges. The lower the ATR value, the lower the volatility. A continued low ATR indicates a possible continued movement or a reversal in the market.
ATR is a great indicator to be used for stop or entry points and is easy to pick out changes in volatility.
Calculation
For example
Calculate ATR, where the previous ATR for the 14 periods is calculated to be 6.3 and 2.4 for the true range(TR) of the next day.
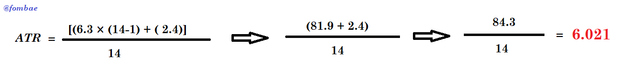
From the result, the current ATR is lower than the previous ATR. It indicates that the volatility has reduced to the lower value from the previous.
2.) What do you think is the best setting of the ATR indicator period?
Picking the best setting is depending on the trader's strategy if they want a more sensitive or less sensitive indicator to the current prices movement. 14 periods is the default setting applied to be the J.Walles Wilders which most trading platforms are using.
The smaller the period setting(short-term trade), the more sensitive the indicator to the current price movement making it easier for the trader to read changes picking slight swings.
The longer the period setting(long-term trade), the less sensitive the indicator to the current price movement making it difficult for the trader to read changes picking swings which will take a longer period.
As I mentioned, the best setting will depend on the strategy to be applied by the trader, so the trader will decide what will work after adding other conditions to the trade.
3.) How to read the ATR indicator? And is it better to read it alone or with other tools? If so, show the importance. (Screenshot required)
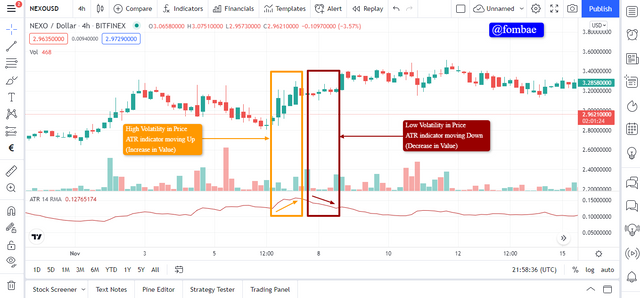
Reading the ATR indicator is not difficult, as the candlestick sizes are easily the means of reading. The moment a trader can pick a constant continuous trend, which will be used to eventually get its average. A large continuous candlestick due to higher volatility of the price will lead to a high ATR value. We have a low ATR value when the market is in a smaller candlestick due to low volatility in price.
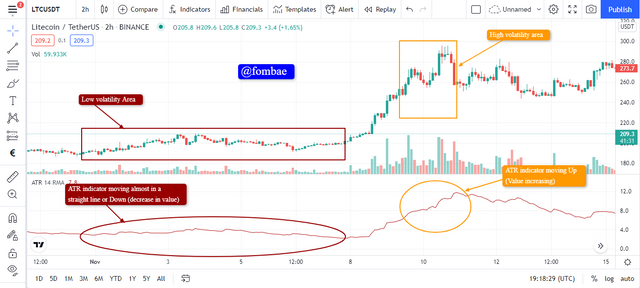
From the image, two sections are alighted. A section with short candlesticks and the other with long candlesticks. Like I mentioned above it is due to the volatility of the asset, and the ATR indicator is used to measure the volatility of the asset. On the chart, the section highlighted in brown color has a small candlestick that continues almost of the same size. The ATR indicator is in a straight line and at some e point moves down resulting in a low value for ATR.
The second section highlighted in orange color has larger candlesticks due to high volatility in the market. As a result, the ATR indicator is moving up, and the ATR value is increasing too.
Is it better to read it alone or with other tools?
From the previous course, I came to pick this important aspect in reading indicators which is not reading a chart with just one indicator. The main reason behind this concept is to avoid falling into false signals in a market. So it is a problem for a trader to combine more than one indicator to be able to pick reliable signal confirmations.
Let's add one more indicator to the chart above. Donchian Channels are also volatility-based indicators, and this is so that a better reliable signal can be identified in the market.
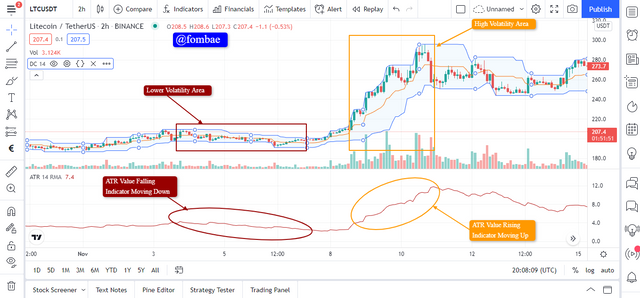
Donchian Channels has two lines that pass above and below the candlesticks. The distance between the two lines helps to tell the size of the candlesticks. The smaller the distance between the lines, indicates low volatility in the market. The larger the area between the two lines, indicates high volatility in the market.
While looking at the Donchian Channels indicator, we can also see the movement of the ATR indicator and changes in value. Note Donchian Channels can help anticipate changes in volatility in price as the two-line either move towards each other (small area) or away from each other (large area) created.
4.) How to know the price volatility and how one can determine the dominant price force using the ATR indicator? (Screenshot required)
How to know the price volatility using the ATR indicator?
The price volatility is well illustrated with the candlestick size. The higher the price volatility, the larger candlestick is formed, and the lower the price volatility, the smaller candlestick is formed. With these changes, the ATR indicator is affected to either move up during high volatility (large candlestick formations) or move down during lower volatility( smaller candlestick formations).
How can one determine the dominant price force using the ATR indicator?
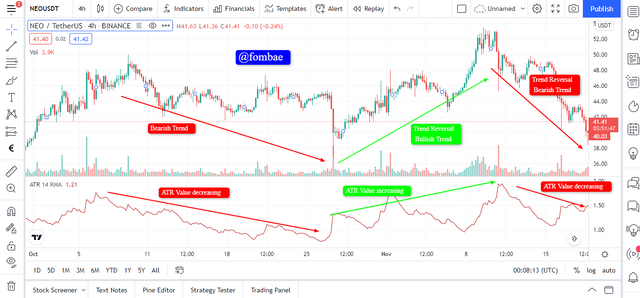
Picking the dominant price force using the ATR indicator depends on the volatility nature of the price, which can either be in a bullish or bearish trend. The nature of the trend can be used in corresponding to the ATR indicator to determine the dominant price force. In a situation where the price is in a bull trend, and candlestick size is small(low volatility). The ATR indicator will be in a downward movement (decrease in value). This shows the opposite direction in the price and ATR indicator. Meaning that the upward movement was not a show of dominance for the price. In the case where the candlestick formations are larger in a bearish trend, and the value for the ATR indicator is increasing. That will show the ATR dominant force over the price.
5.) How to use the ATR indicator to manage trading risk ?(screenshot required)
Managing trading risk with the ATR indicator is about knowing when to take profit and when to take losses. This ate the two aspects to guide any trader adding to the other conditions put in place by the trader to Manage trading risk.
Take Profit(TP)
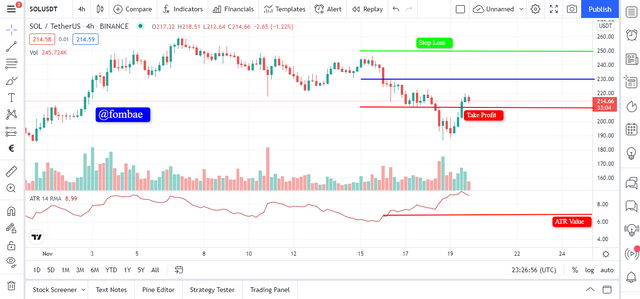
This is the main reason why traders enter trading, to take back profit. Though every trader takes back high profit, it is important to check other conditions when setting high take profit points. To avoid the stress of thinking about where to set a take profit, we can use the formal Entry price +/- 3ATR value to set the take profit point.
Setting a take profit, I will apply an SL/TP 1:1 Ratio strategy to set the point of taking profit since we are dealing with the volatility of the asset. A simple calculation for the chart above will look like this after picking the entry price and ATR value.
TP = Entry price - 3 x ATR
The entry price is $230
ATR is 6.78
TP = 230 - (3 x 6.78)
TP = 230 - 20.34 = $210.34
From the calculation above, I have to set my TP at $210.34.
Stop loss(SL)
This is the point where the trader wants to exit the market if the trend is in a bearish direction. This is to put the trader at a point of little loss as the point of entry in the market was to make a profit. With the ATR indicator, we can be able to pick out a good point to set stop loss using the formula
Stop Loss: Entry price +/- 3x ATR value.
SL = Entry price - 3xATR ( for sell position)
The entry price is $230
ATR is 6.78
SL = 230 + (3 x 6.78)
SL = 230 + 20.34 = $250.34
From the calculation above, I have to set my SL at $250.34.
6.) How does this indicator allow us to highlight the strength of a trend and identify any signs of change in the trend itself? (Screenshot required)
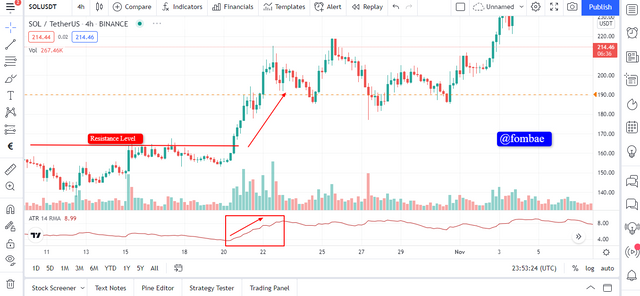
Using the ATR indicator to pick out the current trend is not that easy, given that it measures volatility in prices. In a market trend, a point of high volatility when the price breaks the resistance or support level can be anticipated as a start or continuing of a trend in the market.
Trend Reversal signs
Using an ATR indicator to pick a possible reversal trend is by watching the value trend of the ATR. as the volatility of price stays at a particular trend, causing the ATR value to either be at an increasing or decreasing trend. When the candlesticks get to an exhausting peak or dip, a possible trend reversal sign is anticipated given that the dominant force in the market has been determined by the ATR indicator.
7.) List the advantages and disadvantages of this indicator
Advantages
Traders can apply any time frame depending on the strategy
It simple to understand, as the indicator either moves up or down depending on the volatility in price candlesticks
It is a good tool to use to pick entry and exit points in trading.
Compared to other volatility indicators, it is separated from the chart, making it easy to see both movements of the indicator and the sizes of the candlesticks.
Disadvantages
Difficult to pick potential market trends with the ATR indicator.
ATR indicators can not be solely used for trading without the combination of other indicators.
It is easy for the volatility to be a false trading signal when it shoots out of a resistance or support level.
- Conclusions
ATR indicator is used to measure the volatility of price in the market. Other volatility indicators (Donchian Channels) make it easy for traders as they don't give the direction of an asset's price. A continuous and sudden increase in ATR values is a possible reversal trend in volatility in the price. Thanks, prof @kouba01 for this course this week, and for allowing me to learn about a new indicator (ATR indicator).
Hello @fombae,
Thank you for participating in the 1st Week Crypto Course in its 5th season and for your efforts to complete the suggested tasks, you deserve a Total|5/10 rating, according to the following scale:
My review :
An Average post in which your answers lack depth of analysis and variety in the examples used.
A brief definition of the ATR indicator followed by a calculation of its value, it was possible to rely on a graph to confirm the results obtained in calculating the value of the indicator at the instant t.
It would have been possible to go in more depth to explain the difference between an increase or decrease in the value of a period and to have clearly stated your personal choice.
A superficial answer to the fourth question, you did not deepen your analyzes. The same is true for highlighting the strength of a trend and identifing any signs of change.
Thanks again for your effort, and we look forward to reading your next work.
Sincerely,@kouba01
Thank Prof @kouba01 for reviewing my homework and highlighting the area where I missed it. I will take the remarks into consideration before the next work. Thanks
https://steemit.com/hive-172186/@superman0/achievement-5-task-2-steemscan-com-by-superman0
Please verify my achievement 5 task 2 please sir @fombae
Greetings brother @fombae I have completed Achievement tasks 2-4, please check, bro.
Task2
Task3
Task4
Please guide for the next assignment guide.
Sorry if I interrupt your time.
https://steemit.com/hive-172186/@azamjee/achievement-2-task-basic-security-on-steemit-by
Please verify my achievement 2
kindly please verify my Achievement 2
https://steemit.com/hive-172186/@aliasghar9090/achievement-2-basic-security-on-steemit-aliasghar9090-27-11-2021
Please verify my Achievement 5 task 1
https://steemit.com/hive-172186/@babarsaba/achievement-5-task-steem-world-tool-1-by-babarsaba-24-11-2021