Steemit Crypto Academy week 2 | Homework task for @stream4u | How To Read Candlestick Charts In Different Time Frame & Information about Buy-Sell(Support & Resistance).
Candlestick charts.
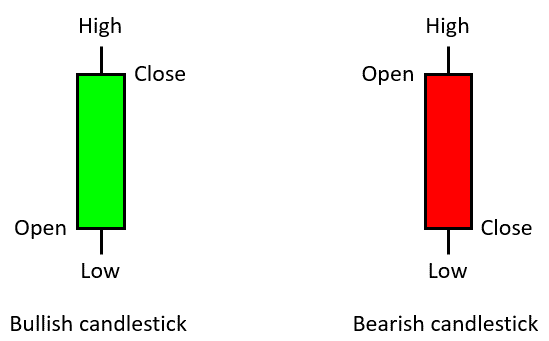
Candlestick charts originated in Japan in 17th century. They are used by traders to predict future market trends on the basis of their pattern in past. Each candlestick shows four price points and they are, opening price, Close price, High price, and low price.
The area between open and close price is known as real body. Price extension above and below real body are known aa shadows or wicks. Wicks represent highest and lowest prices.
The distance between the top of upper shadow and bottom of lower Shadow represents price range.
Red and Green candle.
Green or Bullish candle .
When the closing price is higher than opening price. It means that the buyers control the asset
Red or bearish candle.
When the closing price is lower than opening price. It means that bears control the asset.
Type of traders and their working.
Short term traders :
Short term trading involves taking a position which can last from seconds to days . Short term traders focus mainly on short term gains unlike long term traders which believe on investing assets and have long term strategy in mind. Short term traders can further be classified as
- Scalpers .
- Day traders.
- Swing traders.
Scalpers open trading position for seconds to minutes only. They aim at earning small profit as frequently as possible. Therefore , they have high trading frequency and try to maintain high win to loss ratio. Although , trading position closes in seconds but is a very time consuming process.
Day traders open trading position for a day and usually square off by the end of day to get ready for next trading position. These traders try to take advantage of small market movements in their favour.
Swing traders open trading position for days to weeks. They can be taken as long term traders too because at time they wait for weeks. They try to benefit from short term market movement and at times from medium market movements too.
Long term traders
Long term traders open trading position ranging from weeks to years. They have long term trading strategy in mind. They buy and hold the assets unlike short term traders which buy and sell the assets. I believe these are mostly technically sound people who know the fundamentals of a trade. Long term traders are not affected by knee jerk reaction (short term fluctuations) of market.
Time frames for candlestick charts.
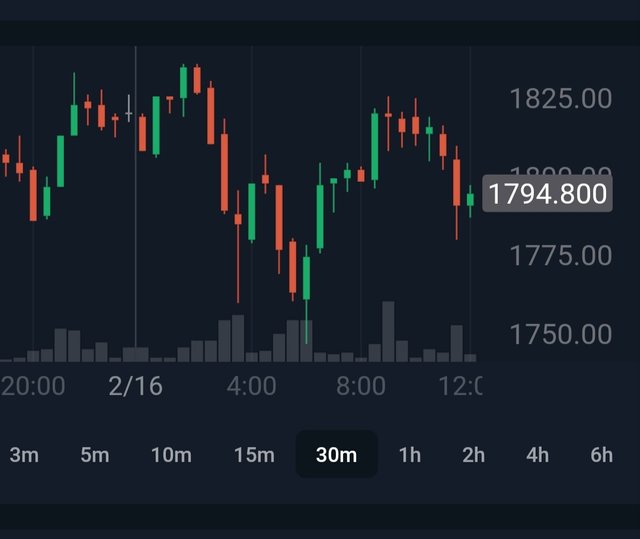
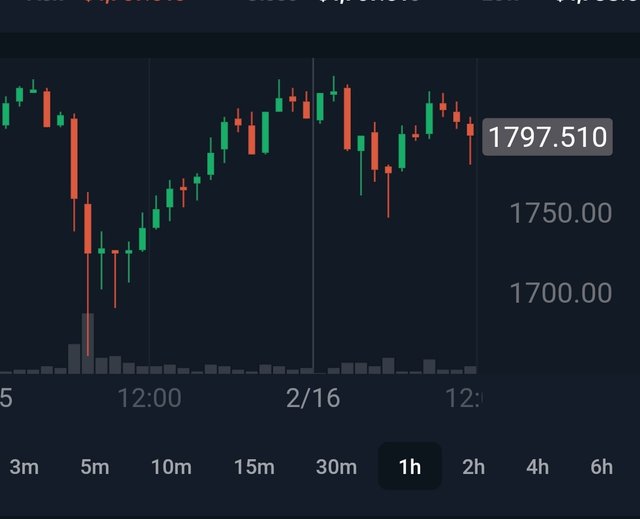
Of the different time frames available ( 1min, 2 min, 5 mins, 14mins , 30 mins, 1 h, 2h , 4h , 6h 1day etc) , i am sharing screenshots below from my bittrex gold app of Etherum in 3 different time frames viz 15 min, 30 min and 1h at an interval of 4 hours
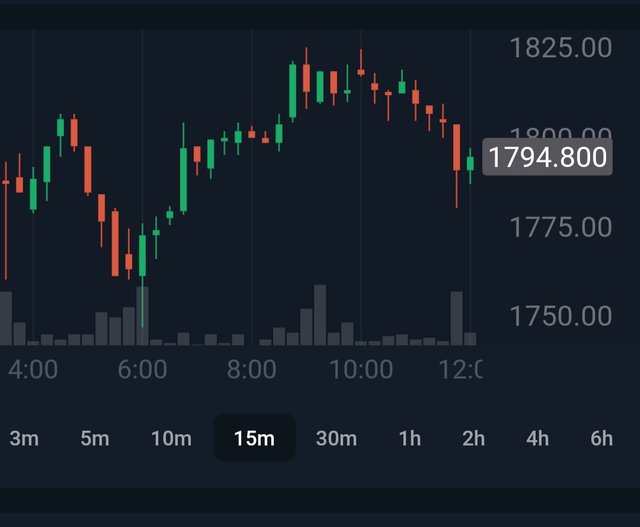
15 min time frame for Eitherum
As we can see that for a single asset (Eitherum) , different patreen of candlestick charts are seen. Depending upon traders preference time frame is set . If a trader wants to set multiple trading position, he will use short trading interval and vice versa. Short term traders use short trading interval and long term traders use long trading intervals.
Support and Resistance
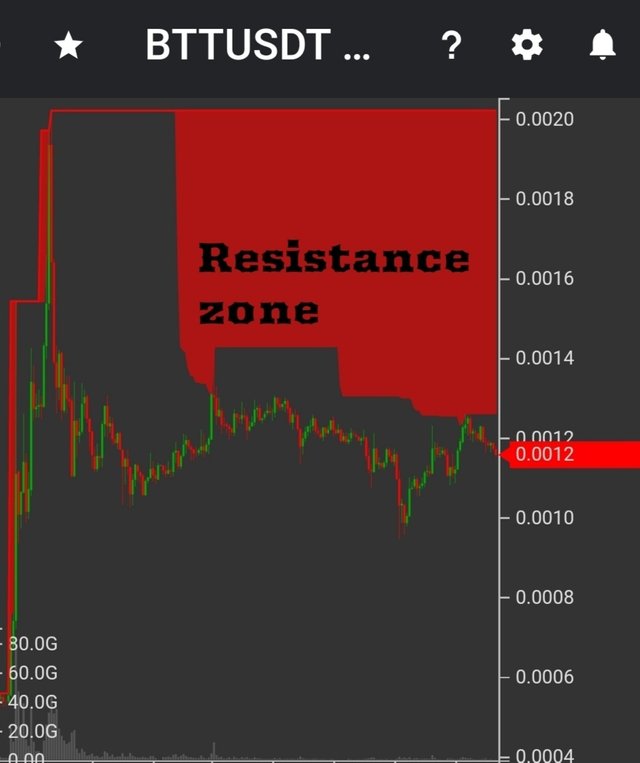
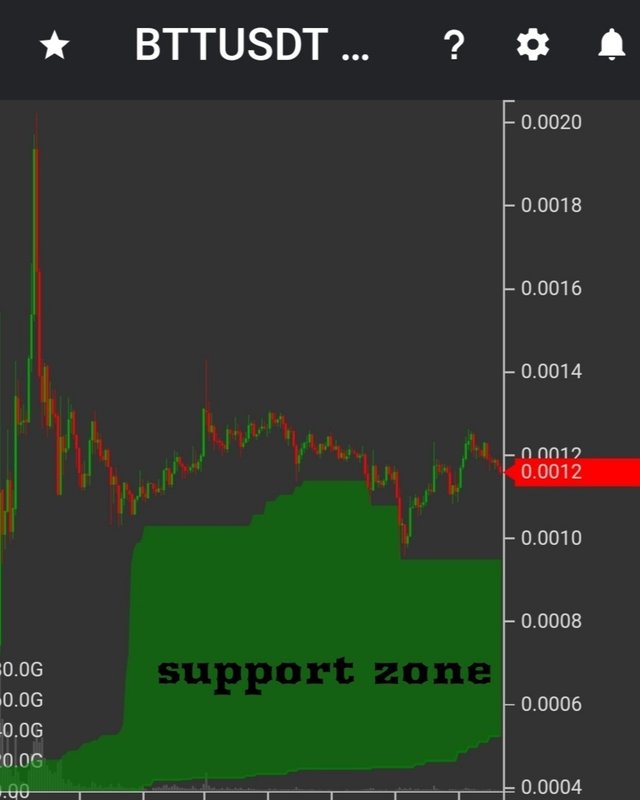 screenshot from my tradiny app
Support represnts a price level where a downward trend is expected to pause. During downtrend as price decreases, buyers increaae and try to halt the downtrend and therefore price is expected to rise. So it represents the point to place BUY order. Support line can be compared to a floor which prevents price from pushing downwards. Support line can be obtained by joining the tops of downward running price peaks.
Resistance represents the point where a upward trend ia expected to stop, which means price of asset is expected to come down. It marks the point where a trader is expected to place a sell order. Resistance can be compared to a ceiling above which price rally runs out of energy and tends to fall back. Resistance line can be obtained by joining tops of uptrending peaks.
Order placement.
Sell order is placed at points in the resistance zone where bullish candle peaks touch the red colored area.
Buy order is placed at points in support zone where bearish candle peak touch the green colored area. For better understanding of buy and sell points, different types of candlesticks shapes like doji, hammer, hang man, morning and evening star etc must be understood. I believe they will be covered in coming chapters
Thanks @stream4u for week 2nd lecture.
100% power up
Twitter shared
.png)
https://twitter.com/Qamran7007/status/1361739532484243456?s=20
Hi @drqamu,
You made a good post on the Homework task 2, explained it very well.
Thank You For Showing Your Intrest in Steemit Crypto Academy
You have completed the homework task and made a good post, explained very nicely about How To Read Candlestick Charts In Different Time Frame & Information about Buy-Sell(Support & Resistance).
Remark: Homework Task Completed.
Thank You.
@stream4u
Crypto Professors : Steemit Crypto Academy
#india #affable
Thank you very much.
Hi @drqamu
I forgot to ask you one thing, just recollected now, as you used a screenshot for BTT, did you brought it? I brought it at INR 0.02 with a huge quantity.
Haven't bought it yet. Was checking for its future potential. I am planning to buy it.
Don't know how you looking at it, but a month ago, it was at a very cheap price, even investing INR 1000 at that time can get a huge quantity. As compared to last month it is now up by INR 0.10. A huge quantity shows a big effect even it is up by INR 0.10.
As I know BTT coin is from the Utorrent, BitTorrent, and the majority of people using it for downloading files. It is running for the last 10 years, I also used Utorrent, BitTorrent and still using it for downloading large applications, games.
Just because of this and looking at a cheap price I entered blindly with just an investment of INR 1000 without any technical indication, got a good huge quantity. now BTT portfolio up by INR 0.13. Even if it's lost, INR 1000 can manageable.
It was just my view.
You are right. I shall purchase it now.