Candlestick Patterns: Steemit Crypto Academy Season 5 Beginers' Course -Homework Post For Task 10 by @bright6126
Hello Crypto lovers on steemit, it is my pleasure to finally present to you my task 10 in the Beginners Introductory tasks. It hasn't been easy I must say but it has been a progressive and educative one for me. I have serially done the previous task in an ascending order up till the last one today. I feel a very strong sensation of ecstasy to finally finished all the tasks in the Steemit Introductory tasks. My deepest appreciation will go to my two professors who have meticulously reviewed all my tasks properly. They are Professor @shemul21 and Professor @dilchamo. One of the best I have met on steemit Crypto Academy.
Without further ado I will move to the Questions of the day.
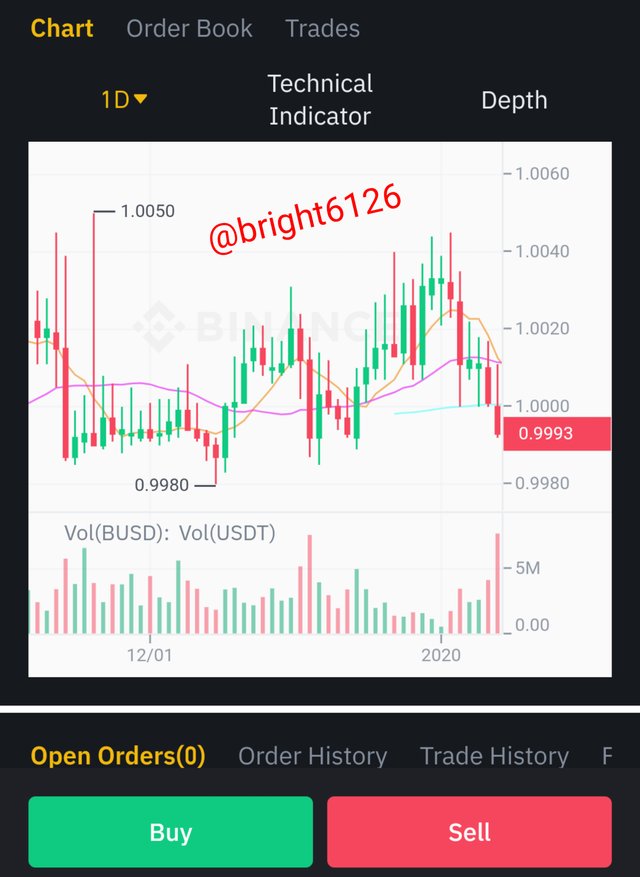
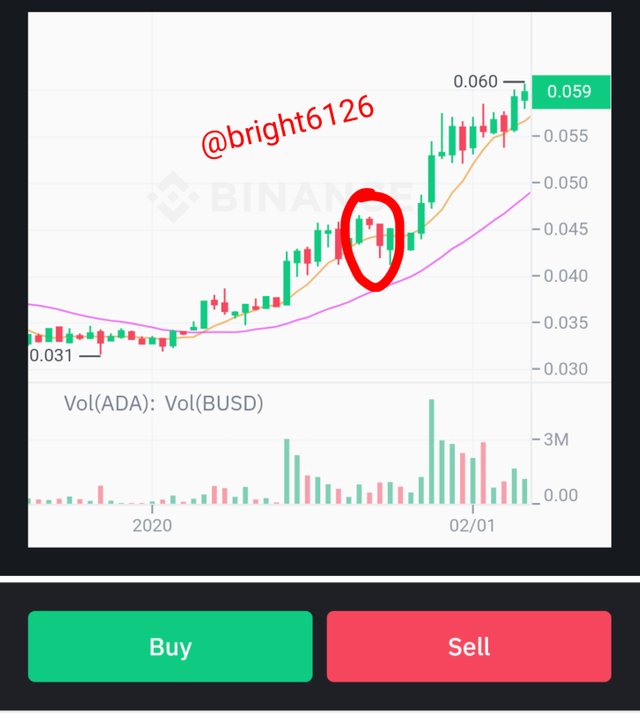
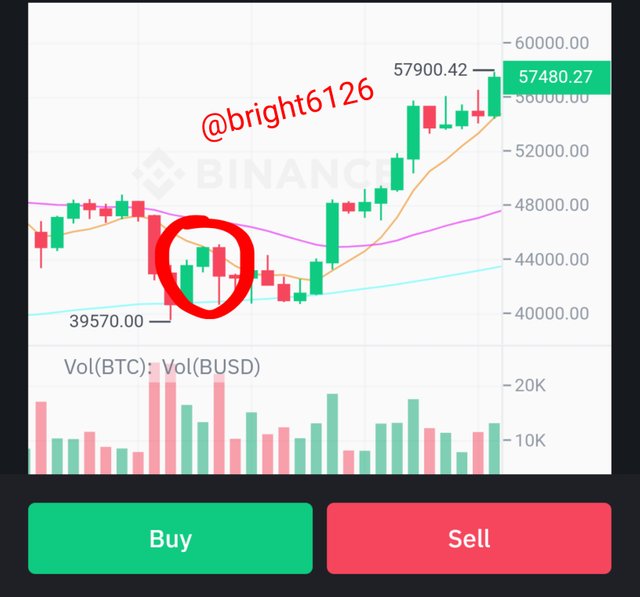
Explain Japanese candlestick chart? (Orginal screenshot required).
In your own words, explain why the Japanese candlestick chart is the most used in the financial market.
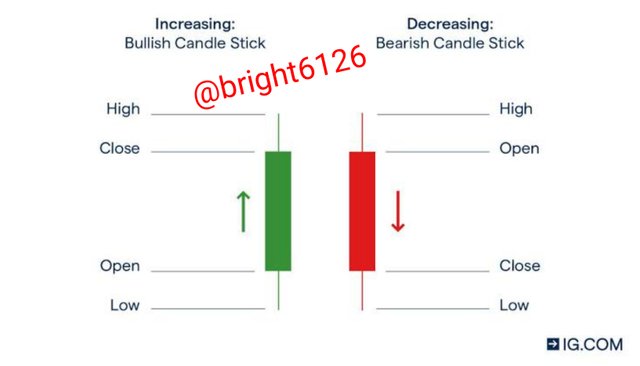
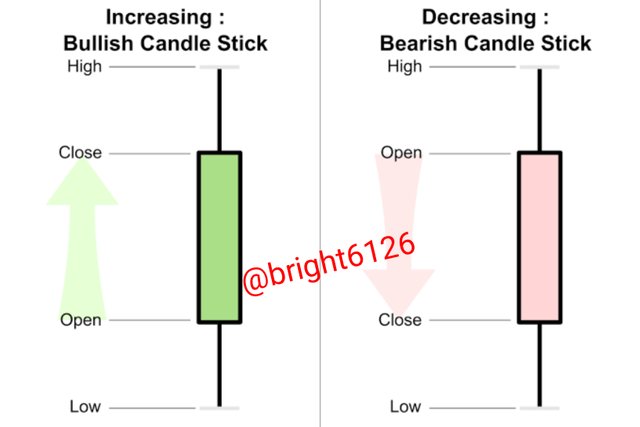
Describe a bullish and a bearish candle. Also, explain the anatomy. (Original screenshot required)
EXPLAIN JAPANESE CANDLESTICK CHART? (ORGINAL SCREENSHOT REQUIRED).
Candlestick charts first came into existence in Japan 100 years even before the Westerners became created the bar and point-and-figure charts. During the early 1700s, there exists a Japanese man called Homma. He discovered that while there was a distinct link between price, supply and demand of the sales of rice, the corresponding markets were highly influenced by the emotions of traders.
The Japanese Candlesticks was able to depict that emotion by visually representing the magnitude of price progressively moves with different types of colors. Traders utilizes the candlesticks character to efficiently come up with trading decisions based on regularly similar patterns that occurs to help forecast the short-term direction of the price.
WHY JAPANESE CANDLESTICK IS THE MOST USED IN THE FINANCIAL MARKET?
Japanese Candlesticks have proven to be very useful during trading as they always show four
different price points (open, close, high, and low) when the traders specifies any period of time it shows them all these 4 different price points and it allows them make trading decisions.
Trading is often dictated by emotion, and the Japanese Candlesticks provides this features which can be read in candlestick charts making it valuable and the most used by traders in the financial market.
DESCRIBE A BULLISH AND A BEARISH CANDLE. ALSO, EXPLAIN THE ANATOMY. (ORIGINAL SCREENSHOT REQUIRED)
BULLISH CANDLE
BULLISH candle can be referred to as a candlestick pattern that emabates in a falling trend or downtrend and causes reversal and that subsequently leads to an uptrend.
It shows a chart that the current buyers have supersedes and taken over the market, or that the current buyers have much trading potentials and are higher than the sellers in the market.
Image Source
A candlestick is composed of parts: the body and the shadow. A candlestick indicates to us a price bar with the following details
- opening price
- a closing price
- a high price for that time period and
- a low price for the same time period.
The body of the candlestick indicates the open and close prices and then, the shadows on the top and the bottom of the body indicates the high and low price for that time period. The shadows are like wicks and for that reason, they are called candlesticks.
In the chart, the colour of the body of the candlestick is what determines if the candlestick is indicating a bullish or bearish price movement. When the opening price is lesser than the closing price we see that the body of the candlestick is white ( although different softwares uses variant colors, with the typical being green or blue). The longer the white body is, then the higher the bullish it is. A very long white body or bar shows that there was an intensive aggressive buying (greed) in that period so we say that the it is dominated by the bulls.
BEARISH CANDLE
A bearish candle can be described as a reversal candle that indicates an uptrend and current changes the financial market. Bearish candles shows that the sellers have dominance over the market and buyers have lost control of the market.
It shows a chart that the current sellers have supersedes and taken over the market, or that the sellers have much trading potentials and are higher than the buyers in the market.
ANATOMY
If the opening price is higher than then closing price we see that the body of the candlestick seems black (although it varies with different software as they tend to use different colors, with the typical being red). The longer the black body in higher chart, the higher bearish we say it is. A long black body or bar shows that there was an intensive selling (fear) in that period and
then we can say bearish are dominants.
ADDITIONAL INFORMATION
There exists two types of candlesticks:
- real body candlesticks and
- no real body candlesticks (also referred to as Doji).
Candlesticks sends a lot of information and message about the psychology of the traders that are trading on that particular stock at that particular time period.
So from this, we can see the resilient struggle between the bulls and bears, and what the outcome was. Sequel to this struggle and the recent records leading up to the pattern you are looking at, it is now possible to that people some times predict correctly what the next price in the the financial market chart move might be.
CONCLUSION
This study has so much exposed me to another concept of the Candlesticks pattern and from which I was able to acquire knowledge on how to critically analyzed the financial market using the Bearish candle and bullish candle anatomy.
I also use this medium to appreciate the entire crypto academy for their support so far as I conclude my Steemit Crypto Academy Introductory tasks with this homework. I have completed all the Tasks Successfully in one season. Specially thanks to the steemit team for an opportunity to learn and get rewarded for it.
| TASK | LINK |
|---|---|
| #1: TRON ECOSYSTEM | LINK |
| #2: STEEM & TRON | LINK |
| #3: THE GENESIS BLOCK | LINK |
| #4:DECENTRALIZATION, BLOCK EXPLORER AND BLOCKCHAIN | LINK |
| #5 BITCOIN, CRYPTOCURRENCIES, PUBLIC CHAINS | LINK |
| #6 DIFFERENT TYPES OF CONSENSUS MECHANISMS | LINK |
| #7 DEX CEX POPULAR EXCHANGES AND TRADING CRYPTOS | LINK |
| #8 DECENTRALIZED APPLICATIONS | LINK |
| #9 BLOCKCHAIN WALLET-- TYPES, USES, INSTALLATION, ETC | LINK |
CC:
@dilchamo


