Steemit Crypto Academy Contest / S14W5 : Exploring STEEM/USDT Trading

Hello everyone! I hope you are all doing well and enjoying life with the blessings of Allah Almighty. I am happy to take part in the exciting challenge hosted by SteemitCryptoAcademy community' Contest (ENG/ESP) Steemit Crypto Academy Contest / S14W5 : Exploring STEEM/USDT Trading || Explorando el comercio STEEM/USDT So, without any further delay, let's dive right in!
Using the MACD, how can you identify a buy or sell signal for the STEEM/USDT pair? And what do the upper band and lower band in the Bollinger Bands for the STEEM/USDT pair indicate? |
|---|
MACD stands for (Moving Average Convergence Divergence) . It's like a helpful tool for folks who play the stock market. Imagine it as a set of tools in a toolbox. These tools help investors to figure out when to buy or sell a stock. It looks at two moving averages to see the trends and changes in stock prices.
One part of MACD looks at two different moving averages. One is faster, like a rabbit, and the other's slower, like a turtle. When these lines cross, it shows a possible change in how the stock's price is moving in which direction. People use this info to guess if they should buy (when the faster line crosses above the slower one) or sell (when it crosses below).
In addition to the crossing lines, the MACD features a "histogram." Not the kind you learn about in history textbooks, of course! This bar chart illustrates how those two lines differ from one another. When it rises, the price of the stock may follow suit. If it declines, it could indicate the reverse.
To put it simply, MACD is a tool that stock investors use to determine when a potential buy oR sell opportunity arises. It looks for possible shifts in the price trend of a stock by using two moving averages & their crossover points. It also includes a histogram that illustrates the variation between these avereages, providing additional insight into potential future price changes.
To spot buy or sell signals on the STEEM/USDT chart, I will utilize the MACD indicator using Tradeview. The steps involve applying MACD to the chart to identify potential trading opportunities in the STEEM/USDT pair.
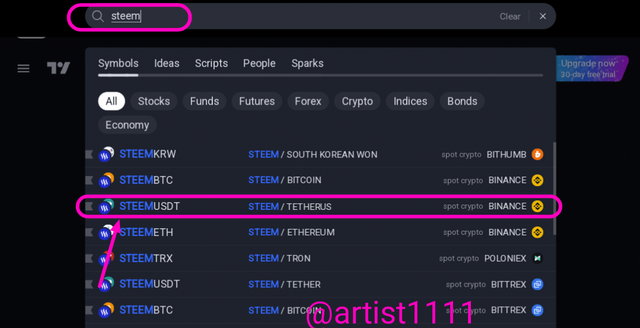
Step 1: First, access Tradeview and locate the trading pair STEEM/USDT to begin the process of applying the MACD indicator.
 |
|---|
 |
|---|
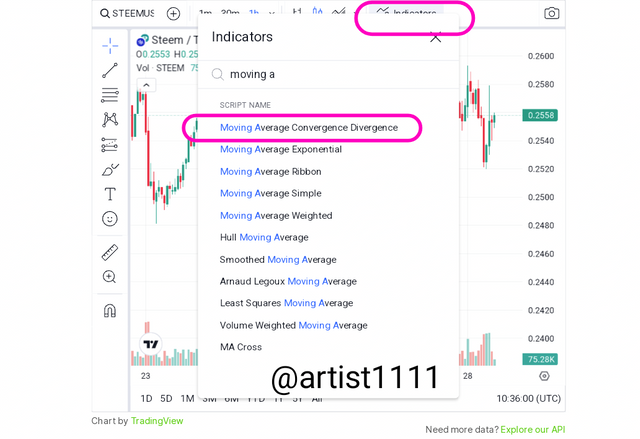
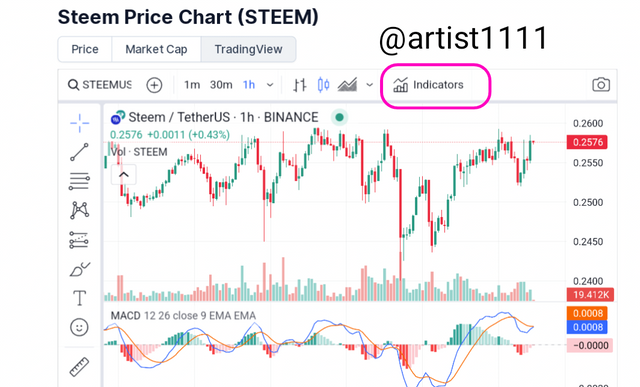
Step 2 : After accessing the chart, find the "Indicators" button usually positioned near the chart's top, then proceed to click on it.
 |
|---|
Step 3 : Next, in the search bar, type "Moving Average Convergence Divergence" and choose it from the displayed list of indicators.
 |
|---|
Now look into above charts ;
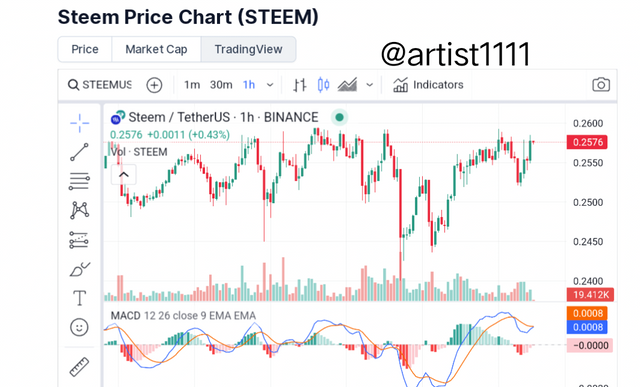
- The MACD line, depicted as the Blue Line in the screenshot, represents the short-term moving average.
- Meanwhile, the Signal line, shown as the Gold Line in the same image, reflects the long-term moving average.
These lines help in analyzing stock trends by indicating short and long-term price averages for potential buy or sell signals.
The screenshot showcases the MACD indicator integrated into the chart, allowing me to spot crossovers between the MACD line and the signal line. It helps identify potential buy or sell signals for Steem.
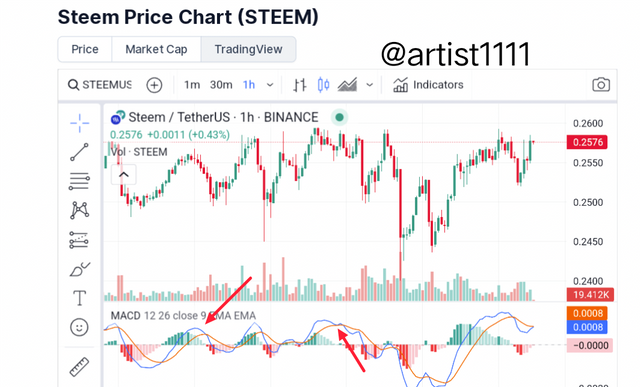
In the subsequent image, red arrows pinpoint moments where the MACD line crosses below the Signal line, indicating potential sell opportunities. Conversely, green arrows highlight instances where the MACD line crosses above the Signal line, signaling potential buying chances.
The histogram mirrors the peaks and troughs, showcasing the upward and downward trends for further analysis of price movements.
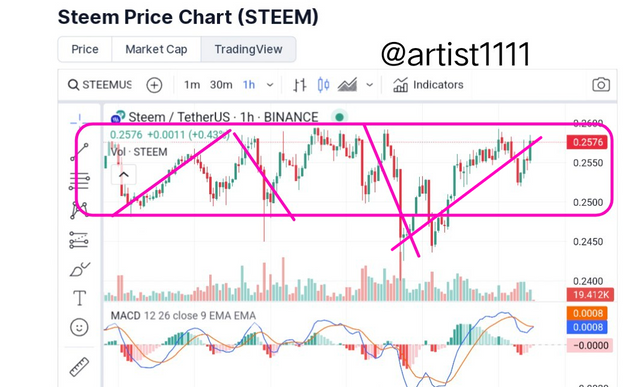
The upper and lower bands of the Bollinger Bands indicator indicate the levels of support and resistance for the steem/usdt pair. A breach in support is implied by breaking the lower band, indicating a possible downward move to test a new support.
 |
|---|
On the other hand, breaching the upper band denotes overcoming the existing barrier and may imply a move toward higher levels or new highs.
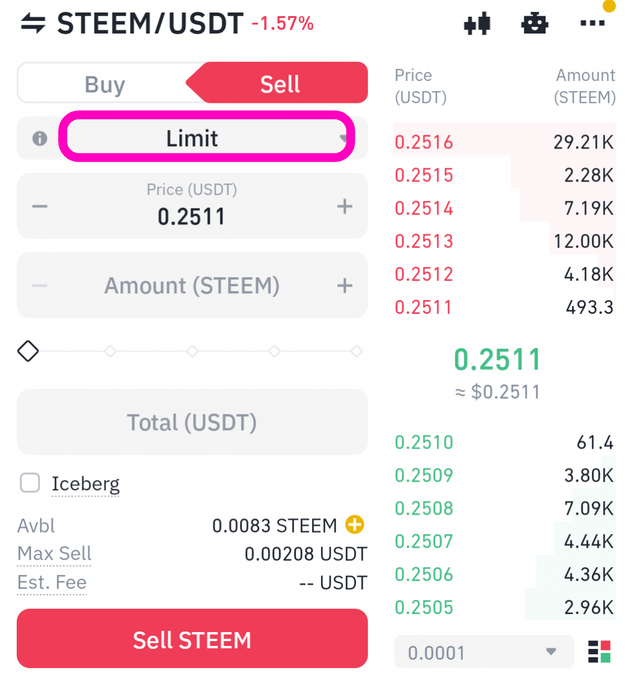
The TradingView chart analysis indicates that the price of steem is bouncing between $2.500 and $2.600, with two dips from $2.500 to $2.430 brought on by selling pressure.
It is currently trading at $2.577, within these zones, indicating that a price breakout—either upward or downward—is imminent. Due of the uncertainty surrounding a potential price change, the MACD and Signal lines are interwoven.
How can the combination of RSI and moving average help determine entry and exit points for STEEM/USDT? And how could a trader use the Stochastic Oscillator to confirm bullish or bearish trends in the STEEM/USDT pair? |
|---|
When evaluating entry and exit points in STEEM/USDT trading, the combination of moving averages and the relative strength index, or RSI, is quite effective.
With the ability to detect overbought or oversold situations, RSI measures the strength of price changes. A probable sell signal is indicated when the RSI crosses above 70, indicating overbought territory. On the other hand, an oversold situation is indicated by an RSI dip below 30, which may be a cue to buy.
Over time, moving averages even out price trends. A price cross above the moving average may indicate an upward trend and act as a buying opportunity. On the other hand, a price drop below the moving average may indicate a downturn and possible selling opportunity.
When traders combine these tools, they search for convergence. For example, if the price crosses below the moving average and the RSI indicates overbought circumstances, this might be a strong sell signal. On the other hand, an oversold RSI combined with a price crossing above the moving average could indicate a compelling time to purchase.
To make better judgments on when to enter and exit STEEM/USDT trading, it is important to employ these indicators in tandem, evaluating their signals collectively rather than separately.
- How to identify entry and exit point in market ;
Through following step i am gonna show you proper research based how to make decision for entry and exit point in market .
Step 1 : Now from the shot we can see that the STEEM/USDT chart is open the old screen shot is mentioning and take a look an indicator option .
 |
|---|
Step 2: Next, locate the RSI indicator by searching and then add it to the chart by clicking on its name Relative strength index .
 |
|---|
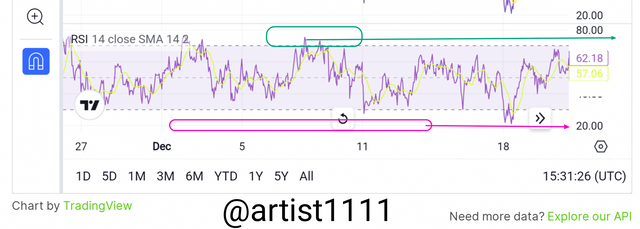
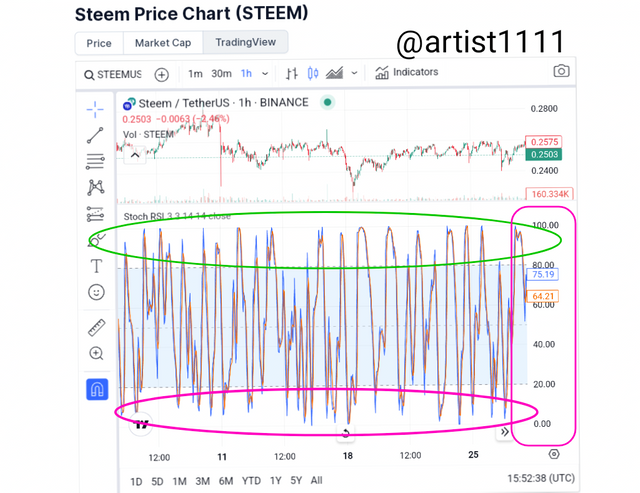
In the shown screenshot, looking for price interactions with specific markings might help identify possible trends and entry/exit points for the STEEM/USDT pair. Potential entry points for traders are indicated when the price approaches or drops below the 20-point level, which is represented by the pink box.
On the other hand, the green spots that indicate possible exits are those where the price approaches or exceeds the 70-point threshold.
These RSI indicator marks—below 20 and over 70—represent crucial milestones that could signal future changes in market momentum. By applying these levels, traders may find the best times to begin or exit positions depending on how strongly the price is moving inside the STEEM/USDT chart.
When it comes to verifying bullish or bearish patterns in the STEEM//USDT pair, the Stochastic Oscillator is useful. An overbought condition is indicated when the indicator's lines cross over the 80 level;; this could portend the emergence of a bearish trend or an impending price reversal. On the other hand' if the lines cross below the 20-point level, indicating an oversold situation, it may validate a bullish trend or an approaching higher price reaction.
For confirmation, traders mix this data with that from other indicators or chart patterns. For example, the price may support the bearish trend if the Stochastic Oscillator reveals that it is overbought (over 80) & the price appears to be peaking or struggling to rise higher.
 |
|---|
The same as a bullish trend may be validated by oversold readings (below 20), that coincide with the price bottoming off or beginning to rise again.
Traders may make better decisions on entry and exit points by utilizing the Stochastic Oscillator in conjunction with other technical analysis tools to better understand potential bullish or bearish trends in the STEEM/USDT pair.
How important is a stop-loss when trading STEEM/USDT, and how can it be set based on technical analysis? Why is it essential to diversify positions when trading the STEEM/USDT pair? |
|---|
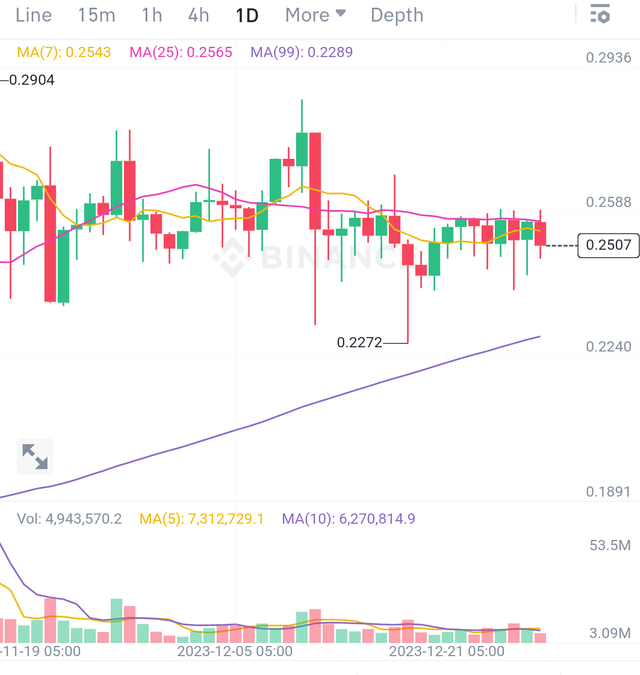
When trading STEEM/USDT, a stop-loss is v-essential because it defines the maximum loss a trader is willing to tolerate on a trade, which helps limit risk. Using moving averages, support levels, or important chart patterns, technical analysts can identify possible places where the price might turn back against the planned trade direction & use that information to set a stop-loss.
Potential stop-loss locations can be found at support levels, which can be found by locating prior market lows or important regions where purchasing demand has traditionally strengthened. In order to account for modest price swings, traders frequently place stop-loss orders just below these support levels.
 |  |  |
|---|
Stop-loss placement is also guided by moving averages. Setting a stop-loss a little below the 50-day moving average, for example, can be taken into consideration if a trader utilizes this average and the price frequently bounces off it during an advance.
 |  |  |
|---|
Stop-loss levels can also be established with the help of chart patterns like trendlines, channels, and Fibonacci retracement levels. Setting a stop-loss just below a trendline that is assisting an upward rise could protect against future reversals.
All things considered, using technical analysis tools in combination to spot noteworthy price levels or patterns helps traders strategically create stop-loss orders, enabling them to safeguard their cash while engaging in STEEM/USDT trades.
To minimize risk and maximize possible profits when trading the STEEM/USDT pair, positions must be diversified. To begin with, it helps distribute risk among several investments or trades. Trades across multiple cryptocurrencies or a variety of assets can help traders spread out their bets and lessen the effect of a single asset's poor performance on their entire portfolio.
Furthermore, diversity can provide exposure to a range of opportunities & market moves. It is possible for various cryptocurrencies to respond to market events or trends in different ways. By maintaining holdings in a variety of assets, traders can take advantage of these differences in market behavior & possibly profit from an asset's rise even as another is down.
It's also an opportunity to experiment with and profit from various trading tactics. By diversifying, traders can try out different techniques on a range of assets and possibly find tactics that work better for particular market conditions or trends.
In the end, diversity is a technique for risk management that helps traders lessen the effects of volatility & uncertainty related to specific assets, potentially enhancing the overall performance and stability of their trading portfolio.
What fundamental factors should one consider before taking a long or short position in STEEM/USDT? and how can external events, such as announcements related to STEEM or stablecoins, influence the trading of the STEEM/USDT pair? |
|---|
Examine STEEM/USDT-related elements such as project advancements, adoption rate, and market mood before deciding whether to go long or short. Evaluating STEEM's technology, community involvement, and applicability in decentralized apps are all part of the fundamental examination.
Events outside of STEEM, such as news about stablecoins or announcements pertaining to STEEM, can have a big influence on STEEM/USDT trade. Partnerships, enhancements, or a boost in adoption are examples of positive STEEM developments that could spark a bullish feeling and raise prices and demand.
Since USDT is a stablecoin, news about stablecoins may also have an impact on investor confidence or market stability, which could have an impact on trading volumes & price fluctuations in the STEEM/USDT pair.
Apart from commonly used indicators, what other leading indicator could be useful to analyze the behavior of the STEEM/USDT pair? and how can trading volume be interpreted to predict future movements of STEEM/USDT? |
|---|
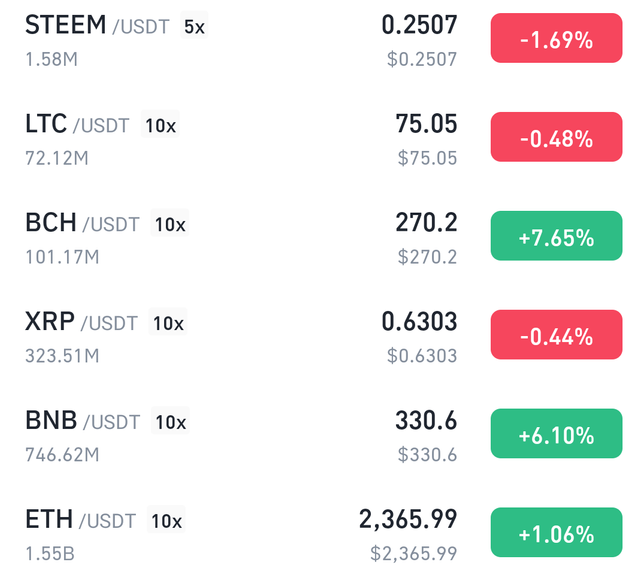
Social sentiment analysis may be a leading indicator for STEEM/USDT in addition to conventional indicators. Keeping an eye on how people are feeling about STEEM's developments or controversies on social media, in forums, or in the community at large may help predict future price movements based on changes in sentiment and public perception.
 |
|---|
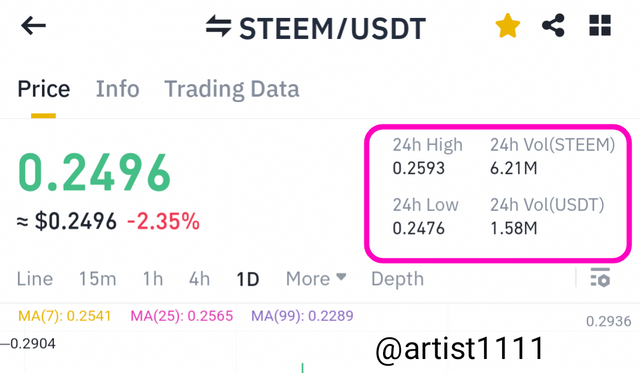
In STEEM/USDT analysis, trading volume is quite important. Significant price fluctuations are frequently accompanied by high trading volume, which suggests heightened market activity and possible trends.
When prices rise and volume rises as well, it could indicate that the positive trend will continue. On the other hand, decreasing volume with an increase in price could indicate a waning trend and potentially cause a reversal.
Low volume during price changes may also indicate hesitancy or a lack of confidence in the direction of the price. Volume analysis along with price changes is a useful tool for determining how strong and long-lasting price trends are in the STEEM/USDT pair.
- Reference
- Steemit Crypto Academy Contest / S14W5 : Exploring STEEM/USDT Trading by sahmie
With Best Regards
@artist1111

Goodbye, friends. It's been a pleasure getting to know you all participating in this community. I will miss interacting with all of you, but it is time for me to move on. Take care & I hope to see you all again very soon , Best of Luck .
As the sun sets on the day
And the night falls softly in
We close this chapter, dear reader
But the story's not yet done
Tomorrow's pages wait, unwritten
INTRODUCTION
As the sun sets on the day
And the night falls softly in
We close this chapter, dear reader
But the story's not yet done
Tomorrow's pages wait, unwritten
INTRODUCTION
Hi friend @artist1111, I have found many similarities in your work and the work @sahmie does and the structure is also similar.
I see that you mention the red arrows that @sahmie has in his graph, but I don't see them in yours.
Written by you:
The writing by @sahmie:
Therefore it is an invalid entry and I encourage you to be original.
Invalid entry.
C.C. @steemcurator01 , @kouba01
I want to start by expressing my respect to both parties involved in the discussion. Then, they recognize that the intensity of the discussion, notably initiated by @artist1111, could have been more moderate, since in our academy, we evaluate the work of students rather than accusing them, and where the aim is not of thwarting your efforts.
Moving to the heart of the matter, i agree with my colleague's point of view, to the extent that the reference the article by sahmie was mentioned, suggesting some form of partial copying. However, i did not consider this to be a major issue and sees it as a learning opportunity for future competitions. i convey that the colleague's respect for @artist1111 remains intact, emphasizing the importance of mutual respect within the academy. Thank you!
Thank you, Professor, for providing a neutral perspective. I want to clarify that my intention isn't to engage in a heated debate. However, I feel compelled to address @pelon53's observation about my post. It raises doubts about my integrity on this platform. Additionally, mentioning SC01 seems inappropriate unless they have discussed this matter to confirm with you there on a social platform .
Now let me share my perspective on it regarding this vary matter ;
Yes, Professor, I agree. I admit that I referenced Sahmie's article, acknowledging the inspiration. Now, the question remains: how much, where, and in what way?
Respectfed professor , I have credited Sahmie's work because I did draw structural inspiration from it. I commend Sahmie for their excellent work, & for educational purposes, I derived ideas up to a certain extent. However, I implemented these ideas in my own manner, utilizing my own screenshots and my own approach. It's important to note that the aspect being highlighted seems to make up a small portion, about 1/8, of my post. Consequently, it feels very unfair that my entire content is receiving negative criticism based on this fractional aspect.
Next, this is very baseless that respected @pelon53 this accusing my content with only time and again "similar to ...." not adding ground proof to prove it or atleast clear it to me so that i can respond him appropriately .
Indeed its not a big issue, yet it raises a question mark regarding my integrity on this platform.
Respected professors, I really apologize if my language seemed intense. I truly respect both of you and value your perspectives. However, the matter concerning my integrity requires a response and necessary clarification. Thank you immensely, @kouba01 professor, for your support ❤️❤️❤️.
Well spoken sir, it's important to start by showing respect to both parties involved in the discussion. It's great that you recognize the intensity of the conversation and how it could have been more moderate. Diving into the main point, you don't see it as a major issue but rather as a chance to learn for future competitions. It's also good that you still maintain respect for @artist1111 and emphasize the importance of mutual respect within the academy. Thanks for sharing your perspective as even I was short of words and not knowing what to say not to offend any of the parties involved. Thank you once again.
Love you brother 💖💖💖💖🙏
Very loose observation by you, professor. I really apologize, but it seems you did not review the entire post thoroughly. I am unsure under what circumstances you are giving this credit solely based on following @ sahmie's structure. While I do follow @ sahmie, my content stems from my own ideas & practical implementation. I firmly believe that practical work is not a product of plagiarism but rather a demonstration of creativity, and that's precisely what I've aimed for in my content.
Regarding your assertion about the absence of the red arrows present in @ sahmie's graph within my work, I must admit that I omitted to include another screenshot. I inadvertently forgot to add it, but I have rectified this error now. I would appreciate it if you could verify and note that I have included the necessary elements.
Your claim of similarities in content prompts my response: while there might indeed be similarities in ideas, I take great care to provide proper attribution and post link of @ sahmie as the source. Despite these similarities, I ensure that credit is duly given where it's due. I acknowledge the ideas' origin & reference @ sahmie, so I am puzzled by your suggestion that my work lacks originality.
Let me know if there's any other aspect you'd like me to address or clarify regarding my content and its relation to @ sahmie's work.
C.c @kouba01
Could you please favor me by providing just one concrete reason why you believe my content is plagiarized? Is it due to following a similar structure or adhering to comparable ideas? I regretfully forgot to upload one screenshot that I had designed earlier, although it's still in my gallery, and I've now rectified that by uploading it.
Additionally for your rest do you think its not enough that I've properly credited @sahmie as the source. What further aspects remain in question and for your objection so for?
Dear friend i give proper reference to the post
Hola @artist1111:
No me opongo a ello, sino que has hecho tu escrito muy similar a Sahmie, Tú puedes usar la fuente, pero debes tener tus propias ideas y no hacer un post similar a otro, aunque pongas las referencias.
No debisteis editar tu publicación, porque eso te hace más sospechoso.
Sin duda alguna, tu escrito es muy similar al de sahmie y debes reconocer que debes hacer tu propia investigación y no copiarte de otro y colocar la fuente.
Saludos
This is baseless; the assertion of similarity to Sahmie's content lacks substantial evidence beyond structure resemblance. I have clearly stated that my post includes my own screenshots & ideas. I admire Sahmie's method of step-by-step explanation, which influenced my post's structural approach. However, I refuse to accept baseless accusations merely suggesting similarity and so for i added sahmie's post reference .
It's quite absurd to solely highlight "Similar to..." without substantiating further evidence and comprehensive grounds. . Furthermore, if you persist in accusing me without valid reasons, I will refrain from further discussion and must only say you are right 👏👏👏. However, I would like to emphasize @kouba01's perspective and review before concluding. This treatment feels unfair and lacks justification .
Upvoted. Thank You for sending some of your rewards to @null. It will make Steem stronger.
Congratulations! This post has been upvoted through Curation Team#2. We support quality posts , good comments anywhere and any tags.
Curated by : @fombae
Thank you dear friend , @fombae 😍.
Dear friend it's a pleasure coming through such an educative and informative article created on steam blockchain just as expected you wrote awesome and intelligently please keep doing the good job.
A little advice for me to you as a friend would be that to avoid similar incident with you and the proof you should avoid sourcing or using a fellow entry as reference to avoid such huge and risky incident
Thanks for sharing wishing you success please engage on my entry https://steemit.com/hive-108451/@starrchris/steemit-crypto-academy-contest-s14w5-exploring-steem-usdt-trading
Hello friend greetings to you. Hope are having good time there.
MACD stands for Moving Average Convergence Divergence. You said It's a very much helpful tool for the traders who trade here. Yes dear it's two moving lines give us surety about our trade. You have beautifully explained all the other technical analysis tools. Though these are the some basic tools, but I believe they give us too much confirmation in normal market.
Along with technical analysis, I think fundamental is too much important too. We should notice all the fundamental news about Steem coin so we can predict it's future price.. Any great development can have too many good effects on steem coin price.
I wish you very best of luck here in the contest.
Hello friend,
Thank you for the way presented your post.
The use of RSI and MA are very efficient in identifying buy or sell entry and exit points. With it, a trader can guars against wrong entry points which can be disastrous to him and eat up his trading capital.
Thanks for showing us how to efficiently make use of both indicator for trading.
Wishing you the best in this contest.
Thank you for visiting mam 😍😍
Hello my dear friend honestly speaking I am shocked 😮 that you have such better understanding of the topic and you have write really well answers
Theost important thing which I like the most is about the diversity you wrote so well best of luck
El oscilador Estocástico nos muestra que tan sobrevalorado o subestimado es el precio de la criptomoneda. Esta información es valiosa para pronosticar las posibles reversiones de la tendencia y encontrar las entradas y salidas oportunas.
Gracias por participar, saludos y éxitos. ¡Feliz Año Nuevo!