SEC S19W5 || Spotting Market Reversals with CCI
This is my homework post for Steemit Crypto Academy Season 19 Week 5, Spotting Market Reversals with CCI.
Note :
- I trade now and then, but I'm not a frequent, nor am I a professional trader. My writing here is essentially theoretical, based on various sources I've read online and my little amount of experience. Any questions that may arise regarding this article will be answered theoretically. By attending classes and completing assignments on Steemit Crypto Academy community, I feel that my knowledge of trading, blockchain, and cryptography-related topics has increased.
- I performed this task on Windows 10 PC, Google Chrome.
See this intro video I uploaded to YouTube (if only Steemit accepted video files).
Task 1 - Define the Commodity Channel Index (CCI), explain its role, calculation formula, components, main purpose, history, and interpretation of overbought and oversold values with real-world examples.
Brief Introduction to Commodity Channel Index (CCI)
The Commodity Channel Index (CCI for short) is a momentum-based technical analysis indicator used in trading. It is basically used to identify cyclical trends in the markets, not just commodities, but also assets and cryptocurrencies. It was developed by Donald Lambert, a technical analyst, trader, and was introduced to public in 1980 in an article in Commodity Magazine. The CCI measures the deviation of an asset's price from its average price over a specified period, usually 14 days.
Its Roles in Trading
The formula developed by Lamberd in the CCI is useful for identifying trends, spotting potential reversals, and gauging market momentum . These objectives are achieved by the CCI by:
- Identifying Overbought and Oversold Conditions
- Overbought. CCI value above +100 sends a signal that the asset may have been overbought, suggesting that a price correction or pullback could happen soon.
- Oversold. Conversely, a CCI value below -100 suggests that the asset may be oversold, indicating a potential buying opportunity as the price might soon recover.
- Detecting Trend Reversals
- Divergences. CCI can be used to spot divergences between the indicator and the price action.
- Crossing the Zero Line. The CCI crossing above or below the zero line can signal a shift in market momentum. A move above zero may indicate the start of an uptrend, while a move below zero may suggest the beginning of a downtrend.
- Confirming Trends. Sustained readings above +100 can confirm a strong uptrend, while sustained readings below -100 can confirm a strong downtrend. Traders may use this information to stay in trades longer during trending markets.
- Generating Trade Signals
- Entry Signals. Traders may enter a long position when the CCI moves from below -100 to above it, signaling the end of an oversold condition. Conversely, they may enter a short position when the CCI moves from above +100 to below it, signaling the end of an overbought condition.
- Exit Signals. The CCI can also help identify exit points. Take this for example: when holding a long position you see CCI moves back below +100, consider exiting the position, because it could be a signal that the bullish momentum is ending.
- Setting Stop-Loss and Take-Profit Levels. Traders may use CCI to set stop-loss and take-profit levels based on the indicator's readings. For example, a trader might set a stop-loss if the CCI crosses back below zero after being in the positive territory, indicating a potential reversal.
- Divergence Analysis. Potential trend reversals can also be signaled through the divergences between the indicator and the price action, which can be spotted by CCI. For example, if the price makes higher highs while the CCI makes lower highs, this bearish divergence can indicate weakening upward momentum and a possible trend reversal.
- Multi-Timeframe Analysis. Traders can use CCI across multiple timeframes to gain a broader perspective on market trends and momentum. For example, a longer-term CCI can be utilized to determine the overall trend while entry and exit points is identified with a shorter-term CCI
The purpose of the CCI and how it achieves that purpose are essentially the same as various other technical analysis tools, but with its own unique characteristics and methods. This makes it a complement to other technical analysis tools, helping traders understand the bigger picture of the market.
To summarize, the CCI is a versatile analytical tool a trader can utilize. It provides valuable insights into market momentum, by signalling overbought/oversold conditions, and also potential reversals. By interpreting CCI signals alongside other technical analysis tools, traders can make more informed decisions and enhance their trading strategies.
The Calculation Formula of CCI and Its Components
The formula and its components for calculating the Commodity Channel Index (CCI) is:

Where:
- TP = Typical Price
- SMA = Simple Moving Average of the Typical Price
- MAD = Mean Absolute Deviation of the Typical Price from the SMA
- The constant 0.015 is used to ensure that most CCI values fall within the range of -100 to +100.
The detail breakdown of the components:
- TP

Created with Adobe Photoshop 2021. - SMA

Created with Adobe Photoshop 2021. - MAD
The original formula for Mean Absolute Deviation is as follows:

Created with Adobe Photoshop 2021.
When it is adapted into the components used in CCI, the formula becomes:

Created with Adobe Photoshop 2021.


So the value of the CCI is determined in a complex way, which may contribute to its high level of reliability.
Example of CCI Calculation Based on 7 Days Data
To calculate the CCI, the required data are the high, low, and close values over the desired time period. For example, in this case, we use data from 7 days, as follows:

Steps to take are:
Calculating the TP for each day.
Result:
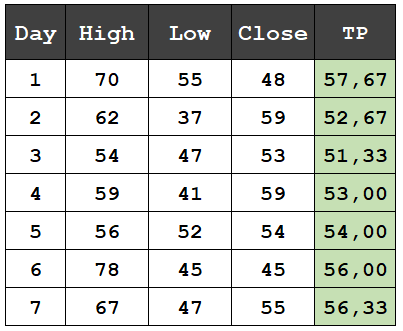
Created with Microsoft Excel 2024. Calculating the SMA of the Typical Price.
SMA = (57.67 + 52.67 + 51.33 + 53.00 + 54.00 + 56.00 + 56.33) : 7 = 54.43Calculating the MAD.
Because MAD is the average of absolute deviation, we need to find the absolute deviation from the SMA for each data point, resulting in the following data:
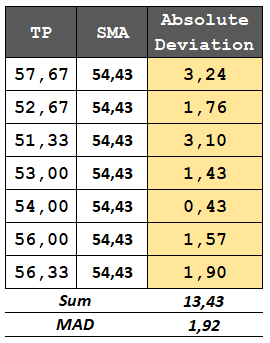
Created with Microsoft Excel 2024.
Resulting in MAD = (3.24+1.76+3.10+1.43+0.43+1.57+1.90) : 7 = 1.92Calculating the CCI value.
Now the CCI formula is ready to play because all data components are ready.
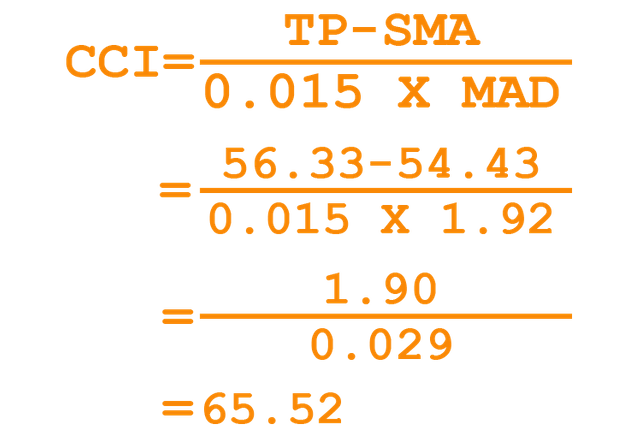
Created with Adobe Photoshop 2021.
The CCI value for Day 7 is approximately 65.52. This value indicates that the current price level is above the average, suggesting moderate bullish momentum, but it's not yet in the overbought territory (typically above +100).


The Main Purpose
The primary purpose of the CCI was to determine the cyclical turning points in commodities' prices, providing a systematic way to identify overbought and oversold conditions. Lambert, the man who developed this analysis tool observed that commodity prices often moved in predictable patterns and cycles, influenced by various economic factors. In other word, relevant to its role, the purpose of the Commodity Channel Index (CCI) is to help traders identify potential market trends and by that, trading opportunities, by measuring the deviation values of the price from its historical average.
Overall, the CCI is a versatile tool that provides insights into market momentum, potential reversals, and overbought/oversold conditions, aiding traders in making informed trading decisions. Specifically, the CCI is used to: 1) Identify Overbought and Oversold Conditions; 2. Detect Divergences; 3) Identify Trend Strength and Direction; 4) Generate Buy and Sell Signals.
The History

Donald Lambert is the man behind the development of the Commodity Channel Index (CCI). He introduced it to the financial community by publishing it as an article in the October 1980 issue of Commodities magazine (now known as Futures magazine). The initial purpose for Lambert designing the CCI is to identify cyclical trends in commodity (oil, metal, gold, and so on) markets, but it now used not only on commodities market, but also stocks, currencies, and bonds.
Lambert was an engineer by training and had a deep interest in market analysis. He developed the CCI as a tool to measure the difference between the current price and its historical average. He believed that markets move in cycles and that identifying these cycles could provide trading opportunities.
While initially designed for commodities, the CCI quickly gained popularity among traders of other asset classes. Its versatility and ability to identify market extremes made it a valuable tool for stock, forex, and bond traders.
Over time, the CCI became a staple in technical analysis. Its ability to highlight divergences, overbought/oversold levels, and potential trend reversals made it a favorite among traders looking for systematic ways to make trading decisions.
The CCI is often used in conjunction with other technical indicators, such as the Relative Strength Index (RSI) or Moving Averages, to confirm signals and enhance trading strategies.
Today, the CCI remains a widely used indicator in various markets. It is a standard feature in most trading platforms and technical analysis software. Traders and analysts use it to gauge market momentum, identify potential entry and exit points, and confirm other technical signals. Its ability to adapt to different time frames and markets makes it a flexible tool for both short-term and long-term traders.
In summary, the Commodity Channel Index, developed by Donald Lambert in 1980, has evolved from a niche commodity trading tool to a widely respected and versatile indicator used across financial markets. Its story reflects the broader development of technical analysis and the search for systematic methods to navigate market cycles and trends.
Real-World Examples of Overbought and Oversold Values Detected With CCI
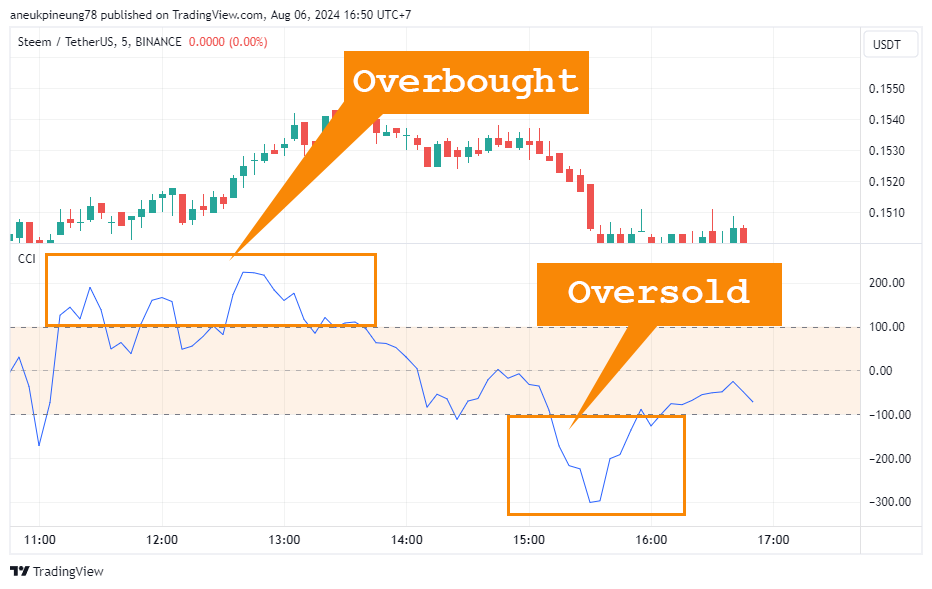
For example, the Overbought and Oversold Values detected with CCI, let’s observe the screenshot from TradingView on the STEEMUSDT market on Binance Spot below. The trade interval was set to 5-minutes.
Edited with Adobe Photoshop 2021.
Image is clickable and might show larger resolution.

Task 2 - Explain overbought and oversold levels, CCI buy and sell signals. Show historical charts demonstrating the use of CCI to spot reversals, and discuss potential limitations of CCI and methods to mitigate them.
What is Overbought and Oversold Levels
In trading and technical analysis, "overbought" and "oversold" are terms used to describe conditions where an asset's price may have deviated significantly from its intrinsic value, potentially indicating that it is due for a reversal. The main concepts are:
- Overbought. An asset is considered overbought when its price has risen significantly and rapidly, often beyond what is deemed sustainable or justified by its fundamental value. This can occur when the buying pressure is excessive.
- Oversold. When an asset’s price falls significantly and rapidly, potentially below its intrinsic value, then it is considered oversold. This often occurs due to excessive selling pressure.
Commodity Channel Index (CCI) can also be utilized to detect overbought and oversold. Here’s how these levels in CCI are typically interpreted:
- Overbought Levels. CCI values above +100 are generally considered overbought. When the CCI exceeds +100, it indicates that the price has moved significantly above its average price, suggesting that it might be due for a correction or pullback. The asset may be experiencing excessive buying pressure.
- Oversold Levels. CCI values below -100 are typically considered oversold. When the CCI falls below -100, it suggests that the price has moved significantly below its average price, indicating potential for a price rebound or upward correction. The asset may be under excessive selling pressure.
CCI Buy and Sell Signals
The Commodity Channel Index (or CCI) can generate buy and sell signals. Here’s how traders can interpret CCI for potential buy and sell signals:
- Buy Signals
- Oversold CCI Reversal. The CCI falls below -100 (oversold) and then crosses back above -100 suggests that the asset might be emerging from an oversold condition and could be poised for an upward move.
- Bullish Crossover. The CCI crosses zero line from below indicates a potential reversal from a downtrend to an uptrend, signaling a possible buying opportunity.
- Zero Line Bullish Crossover. The CCI crosses above the zero line from below, can signal that momentum is shifting from bearish to bullish, potentially indicating a buy opportunity.
- Bullish Divergence. When the CCI makes a higher low while asset price makes a new low, it can be interpreted as weakening bearish momentum and a potential reversal to the upside.
- Sell Signals.
- Overbought CCI Reversal. When the CCI rises above +100 and then crosses back below +100 (overbought), traders should interpret it as the signal that the asset might be emerging from an overbought condition and could be due for a downward move.
- Bearish Crossover. The CCI crosses below the zero line from above signals a potential reversal bearish, suggesting a possible selling opportunity.
- Zero Line Bearish Crossover. The CCI crosses below the zero line from above, can signal the reversal from bullish to bearish, potentially indicating a sell opportunity.
- Bearish Divergence. The asset price makes a new high while the CCI makes a lower high, this divergence can suggest weakening bullish momentum and a potential reversal to the downside.
Historical Charts Demonstrating the Use of CCI to Spot Reversals
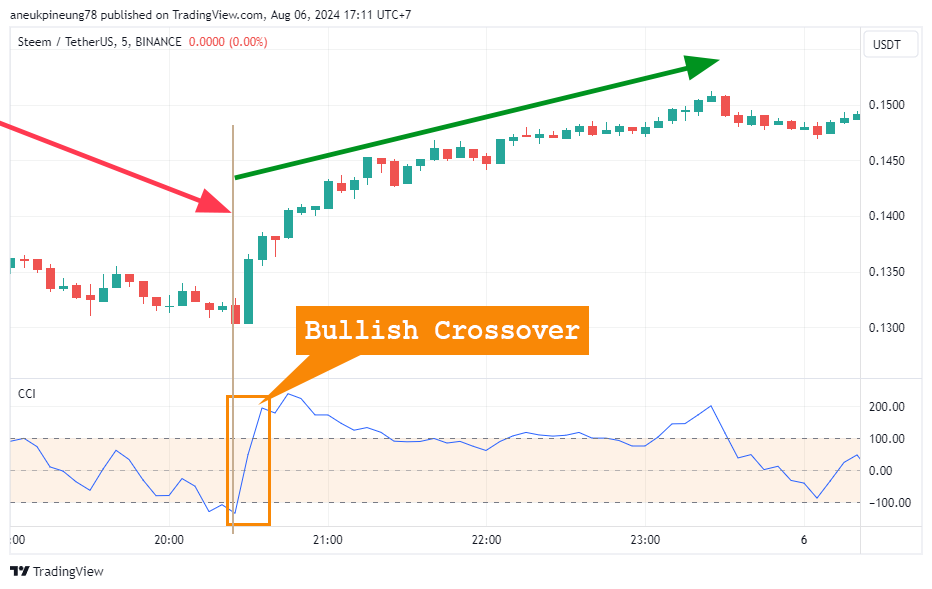
The chart from the Binance STEEM USDT Spot market on TradingView below can be used as an example of how CCI can be utilized to identify reversals. In this case, it shows a change from a downtrend to an uptrend.
Edited with Adobe Photoshop 2021.
Image is clickable and might show larger resolution.
In a bearish state, as shown on the image above, the CCI line crosses from below the -100 line to above it (oversold) indicates a possible trend reversal towards bullish. In the image above, the bullish signal is confirmed when the CCI crosses above the +100 line, and history has confirmed an uptrend following shortly thereafter.
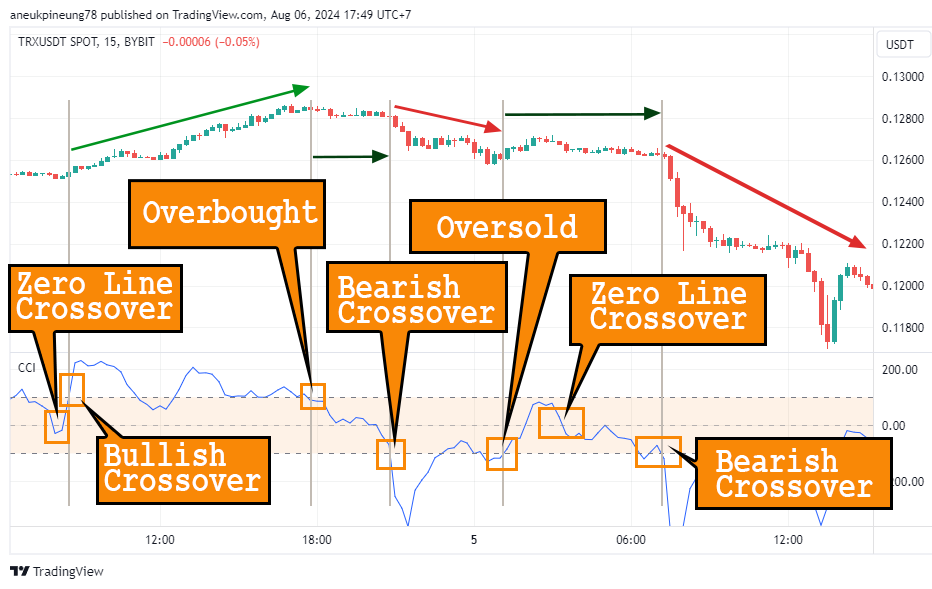
The following image, the screenshot chart of Binance TRXUSDT spot market on TradingView, provides a more detailed observation of the usefulness of CCI in detecting trend reversals.
Edited with Adobe Photoshop 2021.
Image is clickable and might show larger resolution.
Zero line crossover indicates the beginning of an uptrend, strengthened by a bullish crossover (CCI crossing above the +100 line). The market enters a bullish state. Then, an overbought condition occurs (CCI crossing below the +100 line) signaling a trend reversal from uptrend to downtrend. However, the market shows a sideways price movement. The downtrend is confirmed after a bearish crossover (CCI crossing below the -100 line). The price then corrects upwards after an oversold condition. The zero line crossover from above the zero line slightly lowers the price, but it tends to move sideways afterward. After the CCI crosses below the -100 line (bearish crossover), the market enters a bearish condition.
Potential Limitations of CCI and Methods to Mitigate Them
The CCI is a useful technical analysis tool, but like all indicators, it has potential limitations. Here’s a look at some of these limitations and methods to mitigate them:
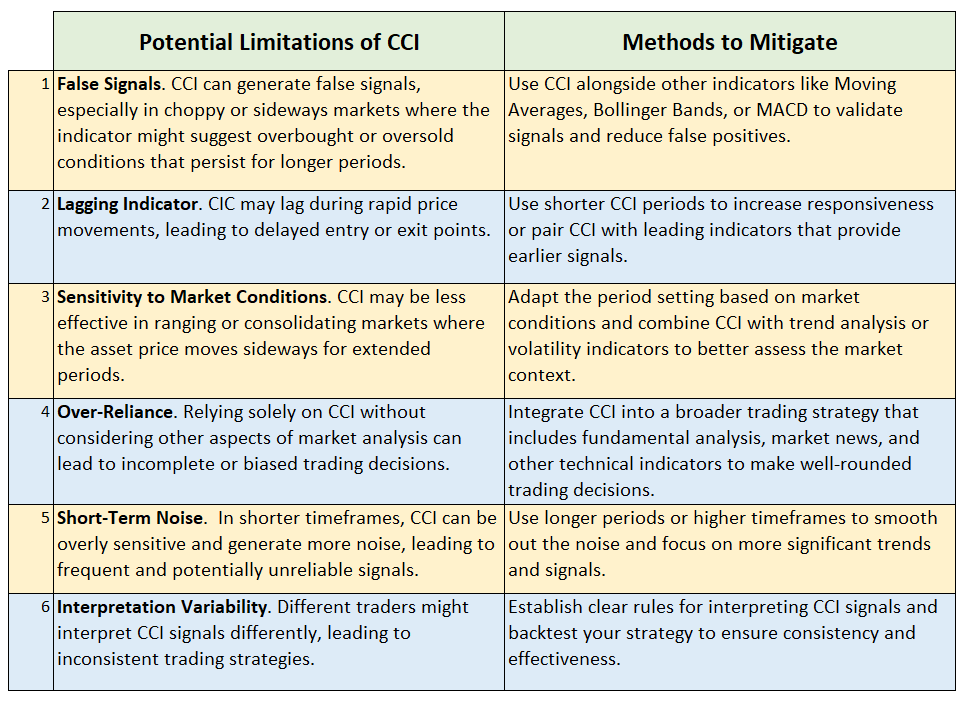
Image is clickable and might show larger resolution.
Task 3 - Discuss the advantages and disadvantages of CCI, its use with other indicators, the risks of false signals, and the impact of cryptocurrency volatility on the effectiveness of CCI.
Advantages and Disadvantages of CCI
CCI is a versatile and valuable tool for detecting market trends and reversals, but it has its limitations. Although CCI has been formulated in detail and can help traders make decisions, it still is not a perfect technical analysis tool. Besides its advantages, it also has drawbacks. Here are its advantages and disadvantages:
- Advantages
- Versatility. CCI can be used across various asset classes (stocks, commodities, forex, etc.) and timeframes (short-term, medium-term, long-term) and be adapted to different market conditions by adjusting the period settings.
- Trend Detection. CCI is effective in identifying potential trend reversals and price corrections by signaling overbought and oversold conditions. It helps in assessing the strength of the trend and momentum changes.
- Simple Interpretation. The concept of overbought (+100) and oversold (-100) levels is straightforward, making it easy to understand and use. Bullish and bearish crossovers are clear and actionable signals.
- Customizable. Traders can adjust the period settings to suit their trading style and the asset’s volatility.
- Disadvantages
- False Signals. Especially in choppy or sideways markets, false signals can be produced by CCi. This can lead to premature trades or incorrect conclusions. Like many indicators, CCI might lag during rapid price movements, potentially resulting in missed opportunities or delayed entries.
- Over-Reliance. Relying solely on CCI without considering other market factors or indicators can lead to incomplete analysis. Traders might overemphasize CCI signals and ignore other important aspects of market analysis.
- Short-Term Sensitivity. In shorter timeframes, CCI may become overly sensitive and generate more noise, leading to frequent signal changes.
- Market Conditions. CCI may be more effective in trending markets and less reliable in ranging or consolidating markets, where overbought and oversold conditions might persist for longer periods.
- Requires Confirmation. To enhance reliability, CCI signals are often used in conjunction with other indicators or chart patterns to confirm potential trades.
CCI Use with Other Indicators
CCI is very useful, but it is not perfect. No tool is. Using it in combination with other analytical tools is a brilliant step and will provide an opportunity to get a clearer picture of market conditions. Here are examples of using CCI with some other technical analysis tools:
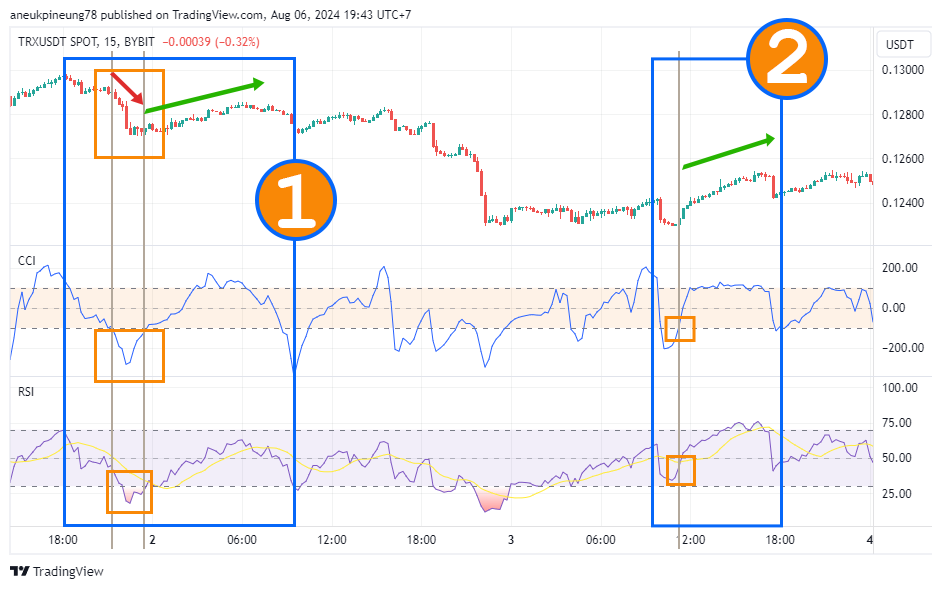
- CCI and Relative Strength Index (RSI). Both CCI and RSI are momentum oscillators, but they are calculated differently. RSI measures the speed and change of price movements, while CCI compares current price levels to average levels over a period. Use RSI to confirm overbought or oversold conditions identified by CCI. For instance, if both CCI and RSI indicate oversold conditions, it can strengthen the signal for a potential buying opportunity.
The following screenshot from TRXUSDT on Bybit 15-minutes Spot Market on TradingView shows how RSI confirms the signals from CCI. At pointer (1), RSI confirms the Oversold condition, then confirms the Bullish Crossover indicated by CCI. The market followed the confirmed signal. At pointer (2), RSI once again confirms the Bullish Crossover.

Screenshot from TRXUSDT on Bybit 15-minutes Spot Market on TradingView.
Edited with Adobe Photoshop 2021.
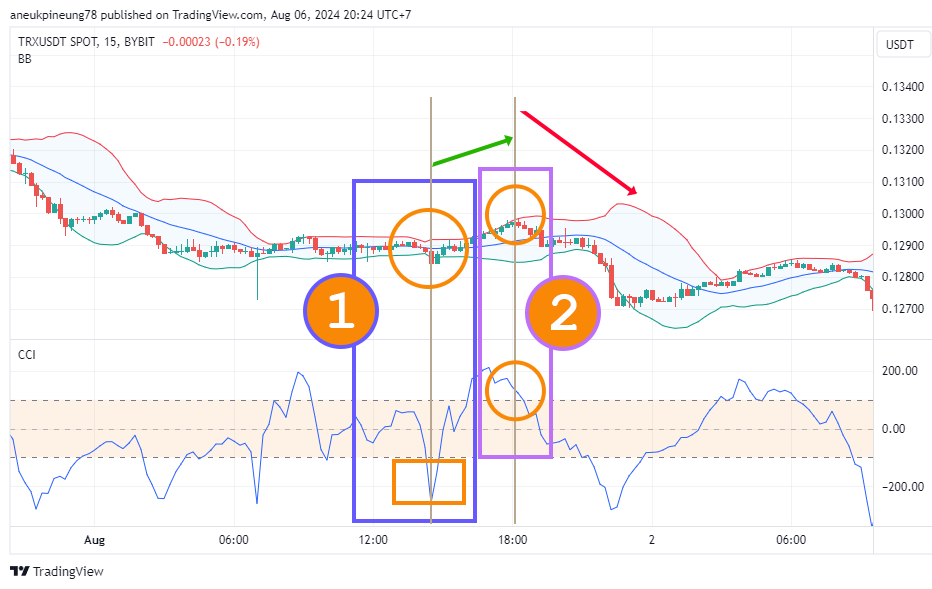
Image is clickable and might show larger resolution. - CCI and Bollinger Bands. Bollinger Bands is a technical analysis tool which consists of a moving average and two standard deviations which is plotted above and below the average. They help indicate volatility and potential price breakouts. Use CCI to identify potential reversals and Bollinger Bands to gauge volatility. For example, if the price touches the upper Bollinger Band (indicating a potential overbought condition) and CCI also indicates overbought, it might suggest a selling opportunity.
For the same TRXUSDT chart I used above, I tried combining CCI with Bollinger Bands and got a picture of how successively markers (1) and (2) each showed Oversold and Overbought conditions. These two technical analysis tools reinforced each other's signals and helped traders take positions.

Screenshot from TRXUSDT on Bybit 15-minutes Spot Market on TradingView.
Edited with Adobe Photoshop 2021.
Image is clickable and might show larger resolution.
The Risks of False Signals
Like any tool, CCI can sometimes produce false signals. False signals occur when the indicator suggests a trading opportunity that does not result in the expected market movement, potentially leading to losses. Understanding the risks associated with false signals in CCI is crucial for traders to manage their strategies effectively.
Just like with other technical analysis tools, the risks posed by false signals in CCI can include:
- Inaccurate Entry and Exit Points. CCI can generate signals that prompt traders to enter or exit a position at the wrong time. For example, a CCI reading indicating an overbought condition might lead to a premature sell, only for the price to continue rising.
- Whipsaw Effect. In volatile or sideways markets, CCI can fluctuate rapidly between overbought and oversold levels, leading to frequent but unreliable trading signals. This phenomenon, known as whipsaw, can cause traders to enter and exit trades in quick succession.
- Trend Misinterpretation. CCI might misinterpret the trend, especially during periods of market consolidation or when the trend is weak. For example, CCI might indicate a trend reversal when, in reality, the market is merely experiencing a temporary pullback.
- Over-Reliance. Relying solely on CCI without considering other indicators or market factors can lead to incomplete analysis. Traders might ignore broader market conditions or fundamental factors that could influence price movements.
Impact of Cryptocurrency Volatility on the Effectiveness of CCI
As we know that cryptocurrency markets are known for their high volatility. It can significantly impact the effectiveness of the Commodity Channel Index (CCI) as a technical analysis tool. Below is some of how cryptocurrency volatility affects the use of CCI in cryptocurrency trading:
- Increased Sensitivity to Price Movements. In highly volatile markets, CCI can react strongly to price swings, often generating numerous signals within a short time frame. Traders may experience difficulty distinguishing between genuine trend changes and short-term price fluktuations, leading to false signals and whipsaw trades.
- Higher Likelihood of False Signals. Volatility can lead to more frequent false breakouts or breakdowns, where CCI signals a trend reversal that does not materialize. This is particularly problematic in cryptocurrencies, where prices can experience rapid and unpredictable changes. False signals can result in entering or exiting trades prematurely, causing losses or missed opportunities.
- Difficulty in Identifying Clear Trends. In a highly volatile market, it can be challenging to identify sustained trends. CCI might frequently cross over its overbought and oversold levels without a clear directional movement in the price, making it harder to use CCI as a reliable trend-following indicator. Traders may find it challenging to gauge the strength and duration of trends, complicating decision-making processes.
There are mitigation methods can be used, such as:
- Adjusting CCI settings to suit the volatility of the asset. A longer period might help smooth out short-term fluctuations, providing a clearer view of the overall trend.
- Combining CCI with other technical indicators such as Moving Averages, RSI, or Bollinger Bands, can help filter out false signals and confirm trade decisions.
- Cross-checking CCI signals across multiple timeframes can help traders differentiate between short-term noise and longer-term trends.
- Implementing strong risk management can help manage risk and limit potential losses when trading in volatile markets.
- Monitoring market conditions such as news events, regulatory developments, and macroeconomic factors, can provide context to CCI signals. Even Though this is not technical analysis tool, it may bring clearer view when deciding position.
Task 4 - Choose a recent Steem/USDT chart, use CCI to analyze and identify reversal points, annotate the chart, and explain the method used. Discuss the validity and usefulness of these reversals for trading.
Analyzing and Identifying Reversal Points on Recent STEEM/USDT Chart
I will use the STEEMUSDT chart in the Binance spot market as seen on TradingView to analyze and identify Reversal Points. I use the chart with a 1-hour trading interval. The data I analyze spans from August 3 to 7 (UTC+7).
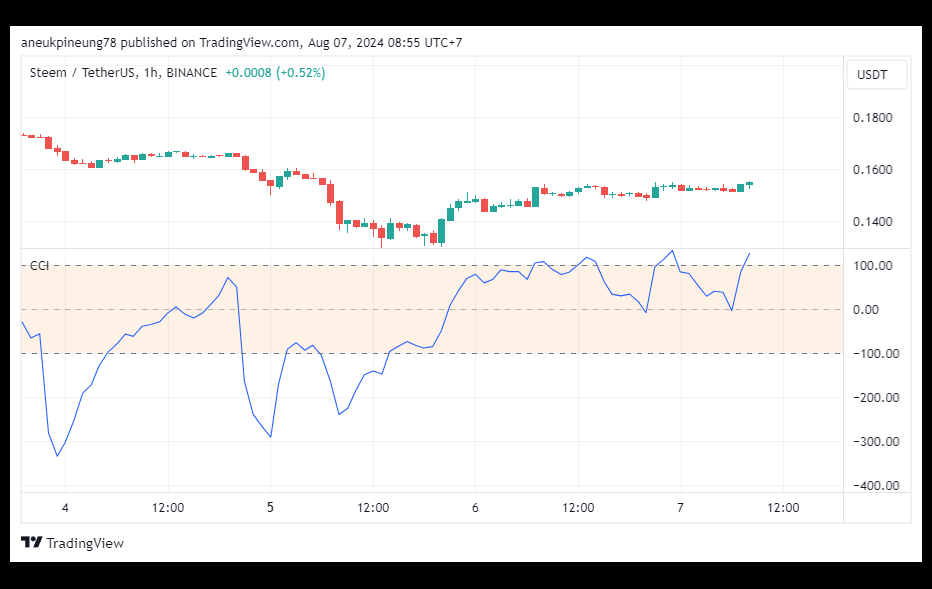
Edited with Adobe Photoshop 2021.
Image is clickable and might show larger resolution.
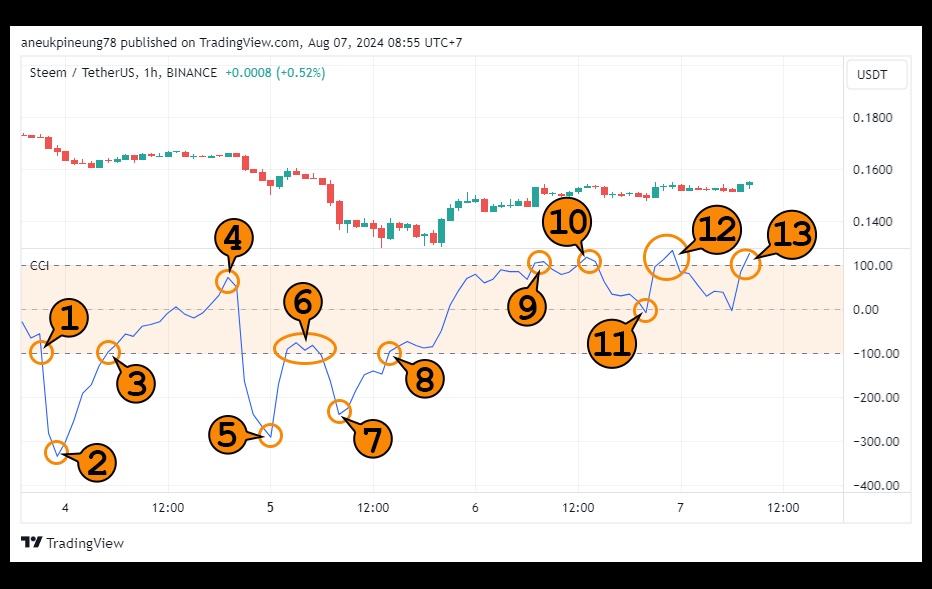
Only CCI
First, I will use CCI without the assistance of any other technical analysis tools. I have added 13 pointers on the chart and I will analyze it based on them.
Edited with Adobe Photoshop 2021.
Image is clickable and might show larger resolution.
Note: All times mentioned in this analysis are UTC+7.
- Pointer (1): At 21:00 on August 3, 2024, CCI crossed below the -100 line (bearish crossover), signaling the possibility that the bearish trend that had been occurring since the end of July might not yet reverse.
- Pointer (2): The lowest point of CCI occurred at 23:00, indicating that the STEEMUSDT market had become oversold. It was evident in the market that the price of STEEMUSDT continued to decline.
- Pointer (3): Following the change in CCI's direction starting at 00:00 on August 4, CCI performed a bullish crossover at 05:00, signaling a potential trend reversal.
- Pointer (4): The peak of CCI's upward movement could not cross above the +100 line, peaking at around 73 on the CCI scale at 19:00. It was observed that from 05:00 to 19:00, the price moved sideways with only a slight increase.
- Pointer (5): The price dropped again, reaching the lowest point 5 hours later at 00:00 on August 5, then showing a directional change.
- Pointer (6): At 02:00 on August 5, CCI showed a bullish crossover, but it only managed to stay above the +100 line for 4 hours.
- Pointer (7): At 08:00, CCI hit another low, around -321.
- Pointer (8): At 14:00 on August 5, CCI made its last bullish crossover before the data collection, and since then, it has remained above the -100 line.
- Pointer (9): On August 6 at 07:00, CCI attempted to break through the +100 line but only managed to stay there for 2 hours. From the time of the bullish crossover (pointer (8) / 14:00), there was a noticeable uptrend.
- Pointer (10): At 12:00, CCI again tried to cross above the +100 line but could only stay there for 2 hours, peaking at 13:00 with a CCI value of +120. The price increased by a few points.
- Pointer (11) and (12): These points suggested good news that the market was rejecting CCI below 0. This could be considered a signal that the price might not decline further and is more likely to move sideways or upward.
- Pointer (13): A positive signal indicating a possible oversold condition, continuing the potential uptrend indicated by CCI since 14:00 on August 5 [pointer (8)].
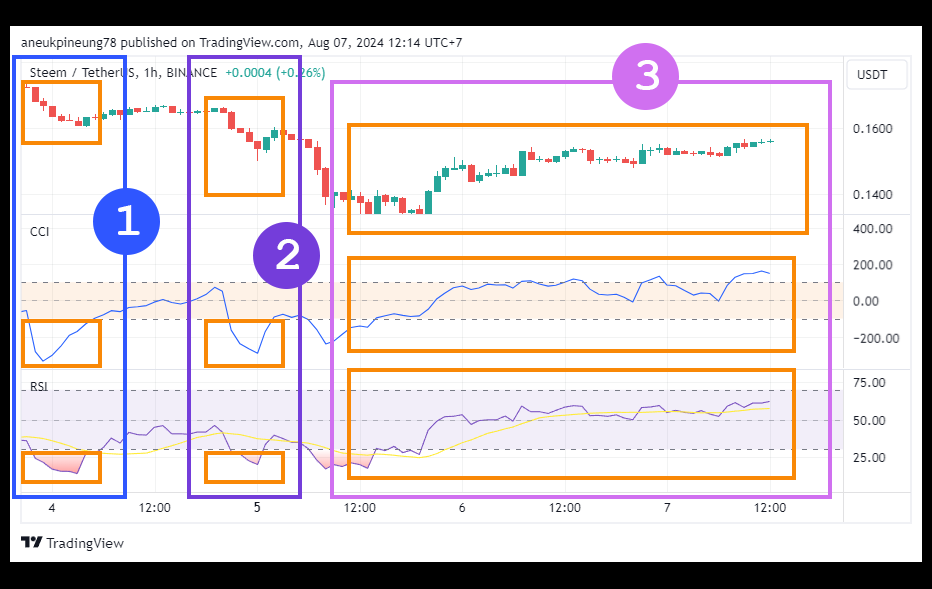
CCI Combined With RSI
Next, I will combine CCI with RSI (Relative Strength Index) and observe how they work together.
Edited with Adobe Photoshop 2021.
Image is clickable and might show larger resolution.
- Through pointers (1) and (2), we can see how RSI confirms the oversold signal indicated by CCI. The market experiences a downtrend.
- Through pointer (3), we can see how RSI confirms the bullish crossover signal shown by CCI. RSI also confirms the bullish signal of CCI by having values that tend to stay above 0, indicating that the market is likely in an uptrend.
The Validity and Usefulness of These Reversals for Trading
It is crucial for traders to validate trend reversal signals to achieve their primary (and maybe only) trading objectives : making a profit. Invalid or false signals can lead to losses, as actions taken based on these signals may contradict the actual market conditions.
Trend reversals are critical signals on which traders can base their position decisions. Therefore, every possible effort must be made to validate trend reversal signals before any action is taken. The usefulness of price reversals in trading includes helping traders in:
- Determining entry and exit points. For example, spotting a reversal from a downtrend to an uptrend allows traders to buy near the bottom and potentially profit from the ensuing upward movement.
- Determining more effective risk management, enabling traders to maximize profit or minimize losses.
- Determining strategies, such as following the trend or going against it.
Task 5 - Describe a CCI-based trading strategy, explain the buying and selling rules, provide historical or simulated examples showing the strategy's effectiveness, and discuss potential modifications to improve its performance.
CCI-Based Trading Strategy
CCI-based trading essentially involves obtaining signals that will help determine positions. CCI is used to identify overbought and oversold conditions and potential trend reversals. The two primary usefulness will greatly help traders to trade successfully.
Buying and Selling Rules
In trading, buying and selling rules are guidelines that traders use to enter and exit positions. These rules are often based on technical or fundamental analysis, or a combination of both. They help traders make informed decisions and manage risk. When using CCI, there are also some set of buying and selling rule. But before, let’s re-observe its ability and usefulness: to identify overbought and oversold conditions and potential trend reversals. Put that to practice, we have buying and selling rules as follow:
- Buying Rules With CCI
- Oversold Condition. Buy when the CCI moves below the -100 line and then moves back above it.
- Bullish Divergence. It is suggested to buy when the price makes a lower low, but the CCI makes a higher low.
- Zero Line Crossover. Buy when the CCI crosses above the 0 line, which can indicate a shift from negative to positive momentum.
- Breakout Confirmation. The CCI rises above +100 indicates strong upward momentum, time to buy.
- Selling Rules Wit CCI
- Overbought Condition. When the CCI moves above the +100 line and then moves back below it, sell. It’s a signal of potenstial downtrend.
- Bearish Divergence. Sell when the price makes a higher high, but the CCI makes a lower high.
- Zero Line Crossover. When CCI crosses below the zero line, sell.
- Breakout Confirmation. The CCI falls below -100 indicates strong downward momentum, time to sell.
Examples of the Strategy's Effectiveness
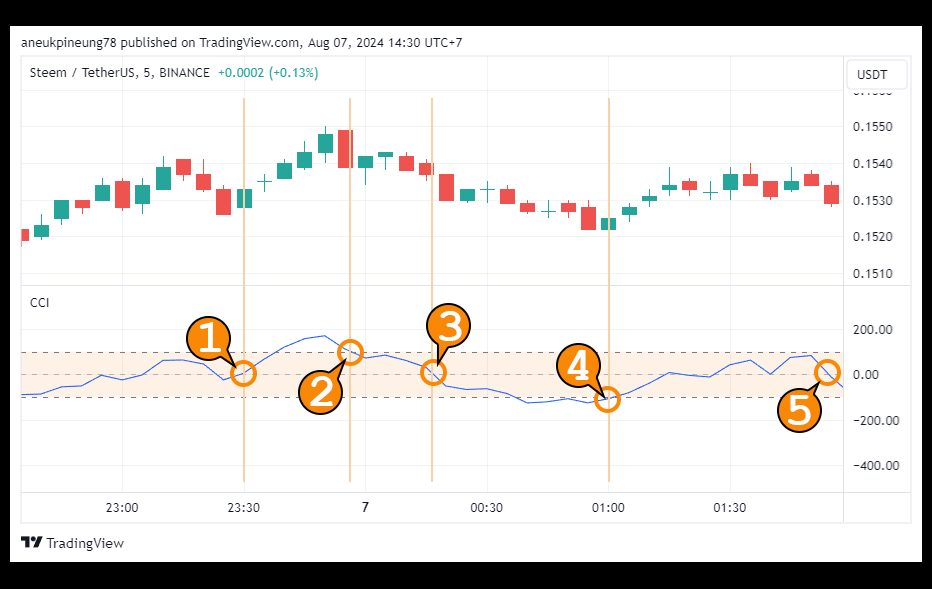
Let's look at the 5-minute chart of STEEMUSDT on Binance in TradingView below.
Edited with Adobe Photoshop 2021.
Image is clickable and might show larger resolution.
- Assuming I don't have any positions, after seeing the CCI cross the zero line (pointer (1)), I believe this is a signal to enter a trade. As seen in the chart, the price starts to climb afterward. At this point, I could buy STEEM at the price of 0.1530 USDT. Let's say I use 100 USDT for this trade, I would get 653.54 STEEM.
- When the CCI crosses below the +100 line (pointer (2)), I will sell, as this is a signal of a potential trend reversal to a downtrend. The possible selling price at that time is 0.1542 USDT per STEEM, multiplied by 653.54 STEEM, equaling 100.78 USDT. This means with an initial capital of 100 USDT, I have made a profit of 0.78 USDT in this trade.
- The market becomes more uncertain when the CCI crosses below the zero line, indicating that prices are likely to decline further.
- When the CCI later crosses above the -100 line, indicating oversold conditions (pointer (4)), I believe it's a good time to buy again. The price I could get at this point is 0.1523 USDT per STEEM. For 100 USDT, I would get 656.60 STEEM. As shown in the image, the price continues to trend upward. Interestingly, even though the CCI does not cross above the +100 line, it remains above the zero line, following the price as it moves sideways. I will continue to monitor the market in this situation.
- When the CCI crosses below the zero line (pointer (5)), signaling a potential downtrend, I sell with a potential price of 0.1533 USDT per STEEM. Multiplied by 656.60, this equals 100.66 USDT. This means I have made a profit of 0.66 USDT in this trade.
- In total, I made a profit of 0.78 + 0.66 USDT = 1.44 USDT with an initial capital of 100 USDT, or 1.44% profit.
Potential Modifications to Improve Its Performance
I think, like all existing analytical tools, CCI also is not perfect and has its weaknesses. However, despite this, CCI is known as one of the popular analytical tools, indicating that it can be relied upon. To my opinion, modifications to mitigate weaknesses and improve its performance can be made in several ways, for example:
- Combining with other indicators. This might be the most important things can be done. By doing it, CCI signals can be confirmed and cross-checked with.
- Adjusting the look-back period. The 20-days CCI lookback period can be adjusted to get more reliable signals. Experimenting on this is a good decision before applying it in the market.
- Using CCI divergences. Divergences are trusted signals to spot trend reversals immediately.
- Implementing Stop-Loss and Take-Profit Strategies. It is basic risk management rules in trading.
- Automated trading systems. A trading system that can automatically execute based on CCI signals will certainly provide greater opportunities for traders to maximize profits and minimize losses. It can free a trader from the need to constantly monitor the market, as positions will be automatically determined by artificial intelligence. This requires a certain level computing skills.
Conclusion:
- CCI, like other technical analysis tools in trading, has its own strengths (advantages) as well as weaknesses (disadvantages).
- To avoid market misinterpretations that may arise from false signals sent by CCI, traders should confirm their findings by combining it with other analysis tools, both technical and fundamental. The more confirmations across different tools, the more accurate the understanding of the asset's condition in the market.
- A well-coordinated mindset is crucial in trading, so decisions are not driven by emotional impulses but are based on information that can be trusted. Trading is not about superstition; it is a real activity that adheres to the facts.
- Sometimes, a loss is a form of profit when it can be prevented before declining further. Therefore, establishing strict risk management is crucial in trading to maximize profit or minimize losses.
Thanks
Thanks @crypto-academy for the lesson.
Pictures Sources
- The editorial picture was created by me.
- Unless otherwise stated, all another pictures were screenshoots and were edited with Adobe Photoshop 2021.
Sources and Reading Suggestion
- steemit.com : Steemit Crypto Academy Contest / S19W5: Spotting Market Reversals with CCI by @crypto-academy;
- investopedia.com : What Is the Commodity Channel Index (CCI)? How To Calculate - April 29, 2024;
- investopedia.com : How Traders Use CCI (Commodity Channel Index) to Trade Stock Trends - September 25, 2023;
- avatrade.com : CCI Trading Strategies ;
- traders.com : THE COMMODITY CHANNEL INDEX;
- investopedia.com : Relative Strength Index vs. Commodity Channel Index: What's the Difference? - September 19, 2022;
- fidelity.com : Commodity Channel Index (CCI);
- asiaprofx.com : Mengenal Indikator Commodity Channel Index (CCI) ;
- foreximf.com : Mengenali Commodity Channel Index;
- atas.net : IS IT POSSIBLE TO COMBINE THE CLUSTER ANALYSIS WITH THE CCI INDICATOR?;
- stockcharts.com : Commodity Channel Index (CCI);
- geeksforgeeks.org : Mean Absolute Deviation;
- aindhae.com : Cara Menghitung Mean Absolute Deviation (MAD) dengan Excel;
- binus.ac.id : Mengukur Error dalam Forecasting;
- bions.id : Tindakan Investor dalam Melakukan Investasi : Cut Loss, Stop Loss, Profit Taking!;
- indiatimes.com : What is 'Stop Loss';
- www.investopedia.com : Stop-Loss Orders: One Way to Limit Losses and Reduce Risk;
- ruangmenyala.com : Cara Mudah Menentukan Take Profit dan Stop Loss Pada Saham;
- www.investopedia.com : Take-Profit Order (TP): Definition, Use in Trading, and Example;
- www.investopedia.com : Risk Management Techniques for Active Traders;
- rhbtradesmart.co.id : Inilah Teknik Risk Management Trading Saham Sederhana Untuk Menekan Kerugian;


Thank you, friend!


I'm @steem.history, who is steem witness.
Thank you for witnessvoting for me.
please click it!
(Go to https://steemit.com/~witnesses and type fbslo at the bottom of the page)
The weight is reduced because of the lack of Voting Power. If you vote for me as a witness, you can get my little vote.
on X :
https://x.com/aneukpineung78/status/1822499402881323402
@stream4u, this is mine. Now I need my pillow. Have a great weekend. Hey @hamzayousafzai, good luck with the contests. I see you've been busy, but this is weekend, mate. 😄
😃😃
Now I find that 24 hours a day is not enuff 😄
yes i checked your entry it perfect wish you best of luck
Like you did, I tried my best to give the best of me to Steemit, my friend. Is all good therre?
Upvoted. Thank You for sending some of your rewards to @null. It will make Steem stronger.
Hari Minggu juga kerja, ya?
Ini unggahnya hari Minggu, bikinnya sejak seminggu lalu... Hahaha.
There is knowledge in everything, not just guesswork. Likewise when trading in crypto.
But there are other important things besides studying the things above, such as the current economy, government regulations, especially the USA and others.
That's correct, I remember on its early days, trading Bitcoin was forbidden in Indonesia people had to do that secretly. It is interesting talking about history of blockchain and cryptocurrency relating to the world acceptance. I keep on asking, will cryptocurrency be adopted globally? That might mean the death of traditional financial system.
I have a draft of an article about the history of blockchain and the response of the Government of Indonesia since the early days of Bitcoin, and the changing in the country regulation related to this subject. I wrote it about 3 years ago and I have edited and add some newer info, but I don't know whether it will make its public appearance or not.
Do you trade, Chief @anroja?
I only buy when prices are low and sell when prices are high (hold). I rarely trade
I guess what you do is not trading, that's more of investing. I do that too. I played shitcoins years ago, turned out they really are sh*t hahahah,,, I lost big money on them .......................
Hahahaha
Yes, I only invest in coins that have potential, such as viral meme coins and several other coins that have a good reputation.
You created indetailed information on Commodity Channel Index. The explanations and examples extremely helpful in understanding Commodity Channel Index better. The traders who are looking to improve their strategies, reading this post can definitely assist them.
What I think Commodity Channel Index is good for short term like week or month holding, but less use for intraday.
Stream4u my friend,,,, you don't need my article to understand CCI, I read yours and I know you understand it no less than me and perhaps more.
Yes, I think so too. I would not recommend using it for short-term trading due to its tendency to generate false signals in shorter-term trades. If it is used, it should be accompanied by strict cross-confirmation and strict risk management.