Crypto Academy / Season 3 / Week 3 - Homework Post for Professor @lenonmc21 : All About Trends, Supports and Resistances and Simple Chart Patterns
This is my homework post for Steemit Crypto Academy Season 3 Week 3 for Professor @lenonmc21’s lesson All About Trends, Supports and Resistances and Simple Chart Patterns.
1. Define in your own words what is a "Trend" and trend lines and what is their role in charts?
1.1. Trend
Trend is the perceived direction of asset price movement over a certain period. Asset prices can change quickly at any time, but the trend is not about the single price change. The trend takes a certain period, for example in one week there are several changes in the price of an asset every day, the one week trend is not about price changes that occur every day, but how prices change from the beginning of the week and at the end of the week, whether at the end of the week the price increases compared to the price at the beginning of the week, or vice versa. So, there are two main things in determining the trend:
- Price change, this is the result of the interaction between supply and demand and bought and sold in market.
- Period, which is a certain range of time, it can be a day, a week, 20 days, a month, five weeks, half a year, and so on.
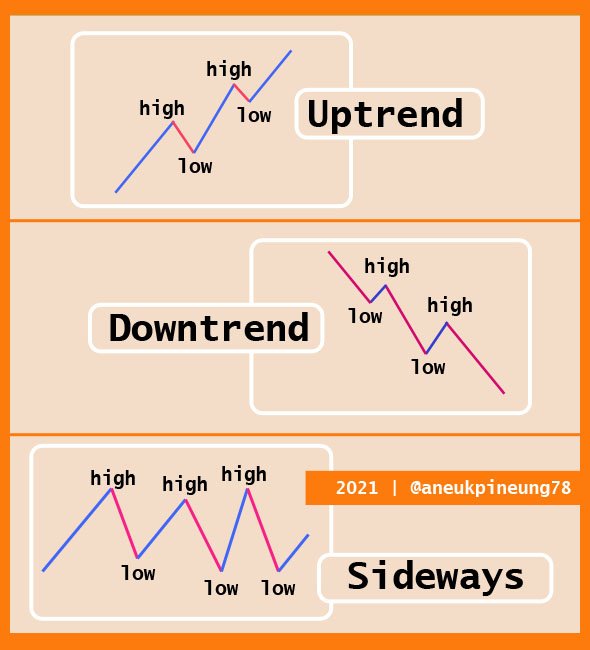
Price changes are not always in an up or down state, but can also be stagnant or in other words there is no price change at all. When the direction of price movement shows an increasing trend, it is called an uptrend. And if on the contrary, the direction of price movement shows a downward trend, it is called a downtrend. Meanwhile, if there is no significant price change or even no price movement, it is called trendless or sideway trend.
1.2. Trend Lines
Trend lines or trendlines are lines created by traders based on the movement of asset prices in the market. Trend lines assist traders in conducting technical analysis to understand the direction of price movements in the market and assist traders in making the right decisions regarding their activities in the market. To draw trendlines you need at least two points on the chart. But it is the better to have a third point as the confirmation that the trendlines is "solid". Every trader can use the timeframe they like to draw the trendlines, be it 1m, 1h, 1d, 30d, and so on.
1.3. The Roles of Trend and Trend Lines in a Chart
Some of the uses of Trend and Trend Lines are:
- Trend and trend lines show the trend in the direction of changes in asset prices in the market, thereby making it easier for traders to understand what is happening in the market and thus help them decide their next move. For example, when trendlines show a downward sloping trend line, it indicates that the market is in high supply or there is an oversupply of assets, this is a signal that traders are more interested in releasing assets than buying.
- Can help traders estimate support and resistance positions. Trend lines can be used to predict a difficult position where the price of the asset is likely to be difficult to rise again, so traders can determine where to put stop-loss.

2. Explain how to draw an uptrend line and a downtrend line.
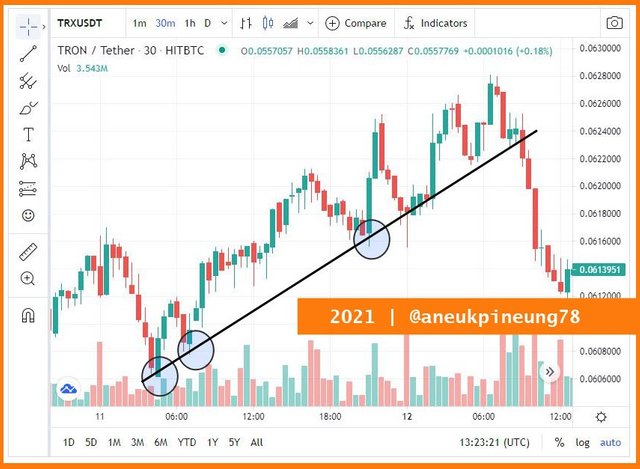
The uptrend line is drawn by connecting at least two higher lows.
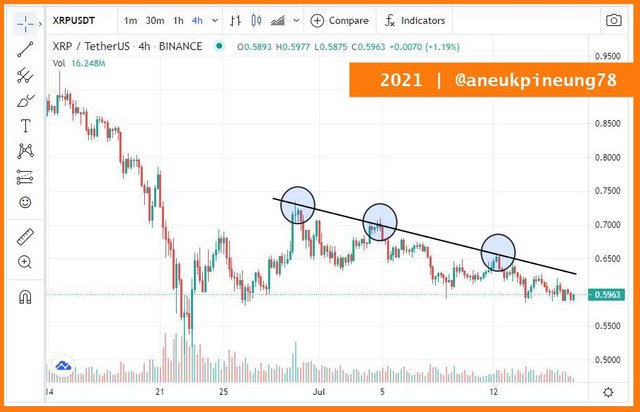
The downtrend line is drawn by connecting at least two lower highs.
While Trendless or Sideways appear when the chart does not have higher lows and lower highs.
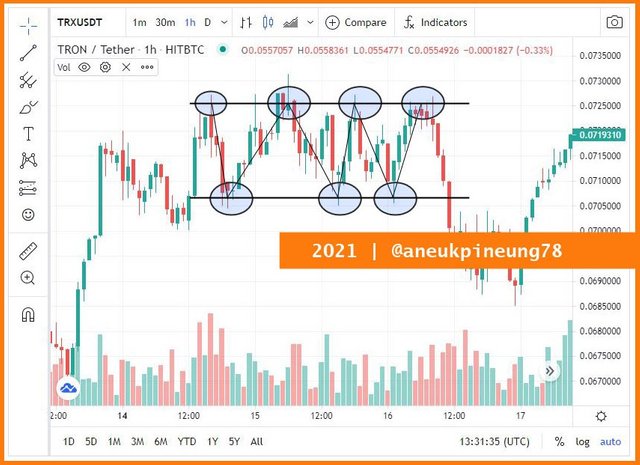
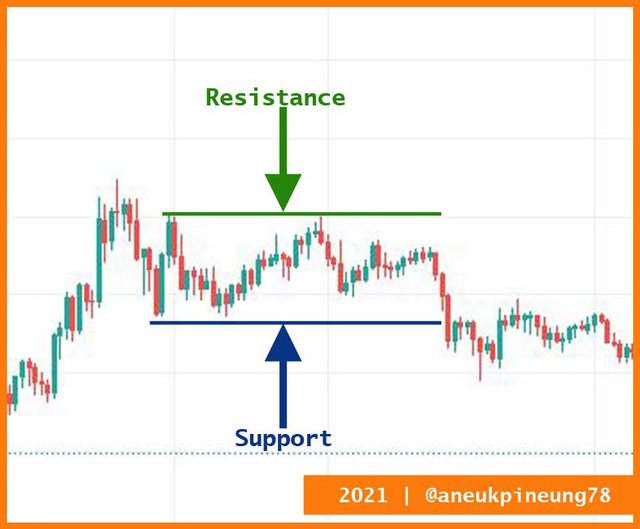
3. Define in your own words what "Supports and Resistances are and how we can identify both zones.
Supports and Resistances are attributes of technical analysis used by traders as a "bulwark" to keep asset price movements within a certain range and not break out far beyond that scope.
- Supports is a line on the chart of an asset's price movement - displayed as a straight horizontal or slightly sloping line - that shows the stock price limit when it can't get any lower. Support can also be interpreted as the "lower limit" of the asset price that traders cannot break within a certain period. Support is a price level area where demand is greater than supply, so it is strong enough to withstand falling prices. At this level, the price tends to stop moving down and most likely will go up again.
- Resistances are the opposite of supports. If Supports is the "lower limit", then Resistances is the "upper limit", that is, the line - horizontal or slightly sloping - on the chart of stock price movements which is generally a reference for buyers not to buy stocks whose price has almost touched the resistance line. The resistance line is a price level area that indicates that supply is large enough to stop the price from rising, and is likely to move down.
4. Explain in your own words at least 2 simple chart patterns with screenshots.
Here are two simple chart patters, namely Double Top and Falling Wedge.
4.1. Double Top
The double top chart pattern is a chart pattern that starts with an increase in price so that it forms a peak then the price goes down and forms a valley which becomes a support point and the price rises again and forms a second peak and then drops again.
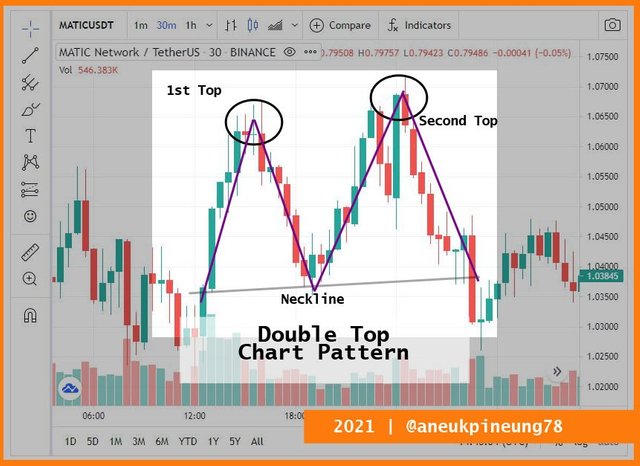
The Double Top pattern highlights how the price formed two peaks of nearly the same height. This means that the market has tried to push the price up, but it turns out that it repeatedly hits the highest price level, then the price drops again from that peak.
4.2. Falling Wedge
Wedge price patterns highlight conical price movements. The indication is that the strength between sellers and buyers is consolidating (equally strong, but volume usually decreases), with a high potential for a breakout in either direction. There are two types of Wedge pattern : rising wedge and falling wedge. Here is an example of a falling wedge pattern.
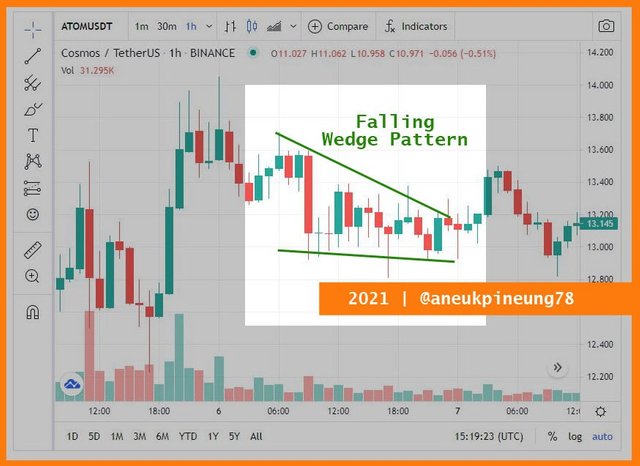
The falling wedge pattern occurs when the resistance line indicates a steeper decline than the support line. That is, the high price decreases faster than the low value. If this pattern is formed during a downtrend, then the price has the potential to skyrocket back. If it is formed along an upward trend, the biggest possibility is that the price will continue to rise again.
Thanks
Thanks Professor @lenonmc21 for the lesson titled All About Trends, Supports and Resistances and Simple Chart Patterns.
Pictures Sourcing
- The editorial picture was created by me.
- All another pictures were screenshoots and were edited with Photoshop CS 3.


Shared to twitter: https://twitter.com/aneukpineung78a/status/1416433618843471886.