Crypto Academy / Season 3 / Week 2 - Homework Post for Professor @reminiscence01 : Beginner's Course | Introduction to Charts
This is my homework post for Steemit Crypto Academy Season 3 Week 2 for Professor @reminiscence01’s lesson Introduction to Charts.

Explain the Japanese Candlestick Chart
Japanese candlestick, as the name implies was introduced by Japanese. It was used to perform technical analysis in rice trading. It was Steven Nison, who shared this technique to the world, after learning and gaining enough knowledge about it. Japanese candlestick is now very popular among traders across the world. It is an efficient tool to perform technical analysis.
The charting concept for this tool was introduced by a Japanese rice trader, Munehisa Homma. It was 1700s when Homma developed his Japanese candlesticks charting. Homma found that the rice market supply and demand were strongly influenced by the emotion of traders. In the candlestick chart, the different emotions are shown with different colors. The candlesticks is useful for traders to forecast the price direction in short term trade.
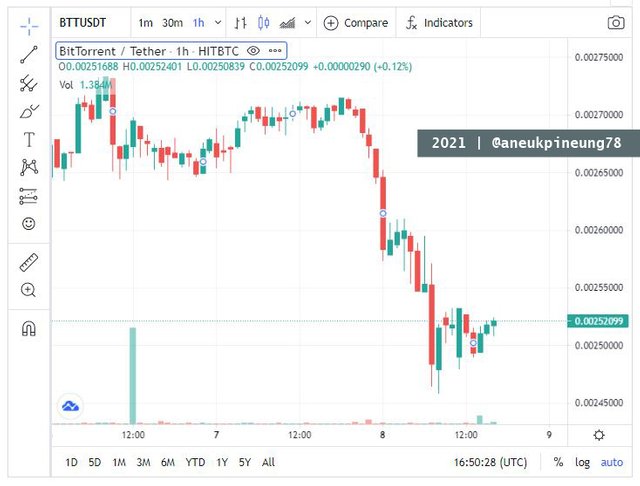
Below is the candlestick chart for BTTUSDT pair as seen on https://www.coingecko.com/en/coins/bittorrent/, Juli 8th 2021, 16:47 UTC.

Describe any other two types of charts?
1) Line Chart
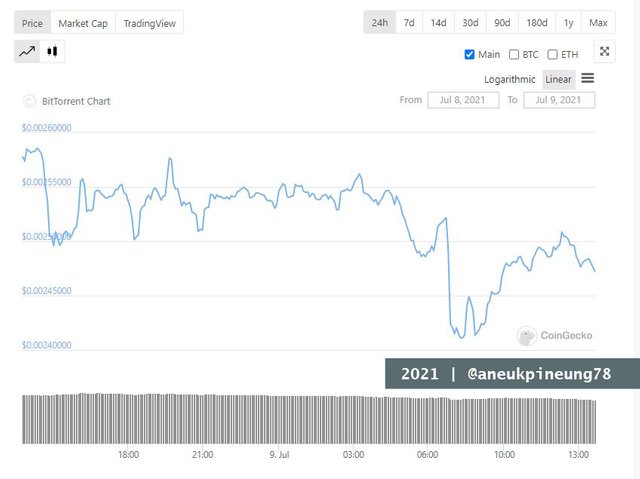
This is the very basic type and displays very little information. It shows the closing price of an asset over a specific period. The closing price it shows depends on the chart timeframe. If the chart is daily, then the closing price of the day is used. The closing price at a certain time is marked by a dot, the line that forms above the chart is the line connecting the points. Below is an example of the line chart, it is BTTUSD as shown on coingecko.com.
2) Bar Chart
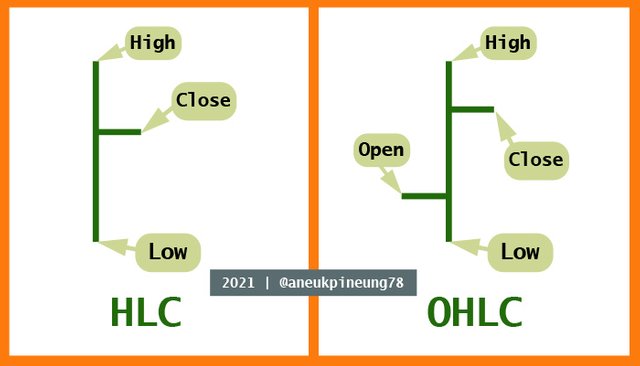
Bar chart displays more information than the line chart. There are two types of bar chart : HLC and OHLC. The terms OLC and OHLC refer to the price information they offer, in which O is for Open, L is for Low, C for Close, and H for High. The Close price bar shown on the right side of the bar, while the Open price bar shown on the left.
Below is the anatomy of HLC and OHLC Bar Chart.
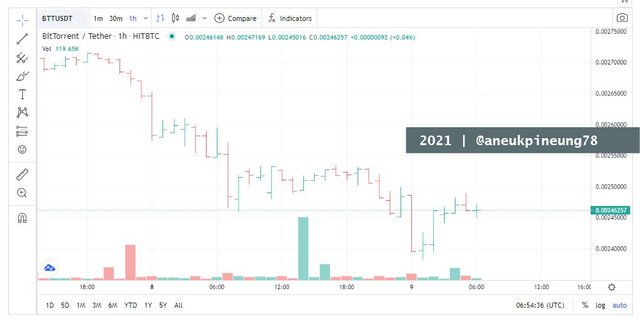
Below is the OHLC Bar Chart of BTTUSD as shown on coingecko.com.
Why the Japanese Candlestick chart is mostly used by traders
- It helps traders understand market psychology. Japanese Candlestick is a technical analysis tool that shows the relationship between price and demand and supply of an asset or commodity, and who really controls the price of asset at an exact moment, is it the buyers or the sellers.
- It presents information about prices. Japanese Candlestick contains data on Open, High, Low, and Close prices for a certain period of time.
Understanding market psychology dan getting informed on market price should be a great help for traders in decision making.
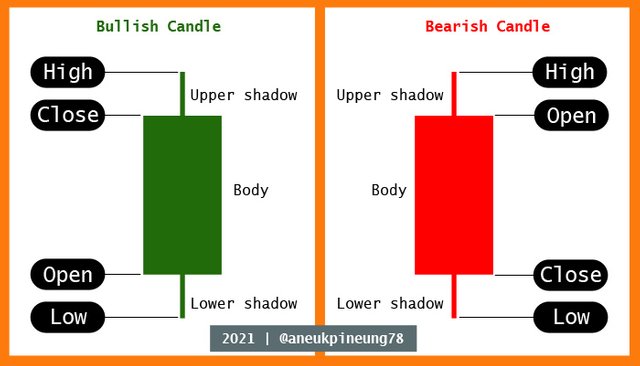
Describe a bullish candle and a bearish candle identifying its anatomy?
On the chart, bullish candles and bearish candles are marked with different colors. Usually bullish candles are colored green and bearish candles are red. Anatomically, the difference between the two is: in a bullish candle, the Close price is above the Open price (close price is higher than open price), while the bearish candle is the opposite (close price is lower than open price). Here is an anatomical picture of a bullish candle and a bearish candle.
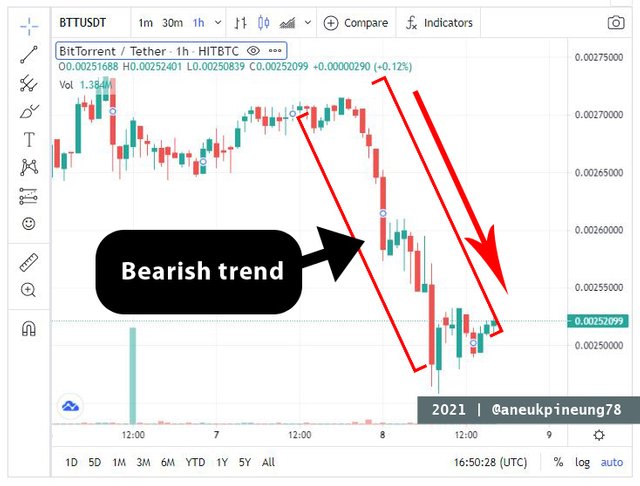
In the BTTUSCT candlesticks chart below we can see the bearish trend formed in the market.
Thanks
Thanks Professor @reminiscence01 for the lesson titled Introduction to Charts.
Pictures Sourcing
- The editorial picture was created by me.
- All another pictures were screenshoots and were edited with Photoshop CS 3.
Sources and Reading Suggestion
- https://www.fxpro.com/help-section/education/beginners/articles/japanese-candlesticks;
- https://www.investopedia.com/trading/candlestick-charting-what-is-it/;
- https://www.kotaksecurities.com/ksweb/share-market/what-are-stock-charts;
- https://www.xtb.com/en/learn-to-trade/chart-types;
- https://www.cmcmarkets.com/en-gb/trading-guides/stock-chart-patterns;
- https://www.babypips.com/learn/forex/types-of-charts;
- https://www.tableau.com/learn/whitepapers/which-chart-or-graph-is-right-for-you;
- https://visme.co/blog/types-of-graphs/;
- https://www.kotaksecurities.com/ksweb/share-market/what-are-stock-charts;
- https://www.edelweiss.in/investology/technical-analysis-2c8d50/types-of-charts-in-stock-market-9b5930;
- https://www.liberatedstocktrader.com/compare-stock-chart-types/;
- https://investorplace.com/2012/08/4-reasons-to-trade-with-candlestick-charts/;
- https://www.logikfx.com/post/6-pros-cons-of-candlestick-charting-in-forex;
- https://blackwellglobal.com/japanese-candlesticks-technical-analysis/;
- https://www.ig.com/en/trading-strategies/japanese-candlestick-trading-guide-200615;


Hello @aneukpineung78, I’m glad you participated in the 2nd week of the Beginner’s class at the Steemit Crypto Academy. Your grades in this task are as follows:
Recommendation / Feedback:
I'm not impressed with your submission. Please put in more time to answer the questions and also work on your presentation. Thank you for submitting your homework task.
Thanks, Professor.
Shared on Twitter: https://twitter.com/aneukpineung78a/status/1413443908227387392.