Hawaiian volcanoes - Part 8: Volcano Monitoring
At the beginning of the 20th century, the way people treated the threats that volcanoes represent changed. Lead by the efforts of Thomas A. Jaggar, Jr. people came to the understanding that short-lived expeditions as response to volcanic eruptions are not enough. To understand the volcanic activity and to be able to avoid catastrophes, one must study the volcanoes continuously. He inspired the founding of the Hawaiian Volcano Research Association (HVRA) and with their support established the Hawaiian Volcano Observatory (HVO) which is run by the US Geological Survey. From there people study the activity of Mauna Loa and Kïlauea on a permanent, scientific basis. From there volcanology was molded as a modern science.
Since its foundation, scientists at the HVO have developed and refined most of the surveillance techniques now commonly used at volcano observatories worldwide.
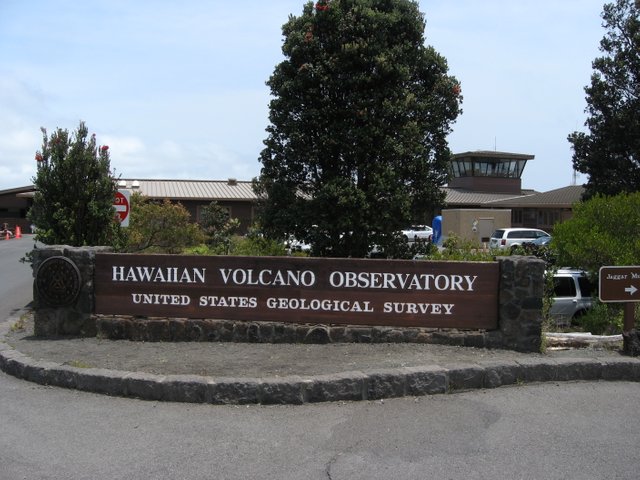
Picture of the Hawaiian Volcano Observatory.
commons.wikimedia.org
,_Hawaiʻi_Volcanoes_National_Park,_Hawaii_(4528768779).jpg)
To understand the behavior of a volcano and to increase the chances to be able to predict eruptions, constant volcano monitoring is required. As the name might suggest, it comprises the observations (visual or instrumental) that document the changes of the state of a volcano during and between eruptions. Through the work at the HVO these changes are well understood for Kïlauea. Mauna Loa has been less studied, but certain patterns have been recognized.
By actively going into the field, geologists monitor volcanoes by visiting the active vents and lava flows. This includes in person observations, as well as observations made from aircrafts and webcams.
On their webpage the USGS says:
Geologists require "boots on the ground" and "eyes in the sky" to observe volcanic eruptions and their impacts. []
No matter how good all machine observations can get, direct observations are crucial for a comprehensive understanding of volcanic activity and its impact on the people and the infrastructure.
Observations made in the field are mapping the areal extend of lava flows and their effusion rate. By walking along the edges of the lava flows, mapping can be done in the most detailed way, but observations made from the air are much faster, while some of the sacrificing accuracy. The estimates of effusion rates (volume of lava erupted per unit of time) are used to characterize the intensity of an eruption. Adding the average thickness of a lava flow to the areal extends determined by the flow mapping creates those estimates. Another way of estimating effusion rates is to look at lava tubes. The width of the lava inside the tubes can be measured by with radio waves and the velocity of the lava stream can be measured through little openings inside the lava tube. A further technique to estimate effusion rates is by measuring sulfur dioxide (SO2) concentrations. Amounts of SO2 are proportional to the amount of lava effused.
Constant observation is not always possible and geologists have installed a network of webcams that record time-lapses of Kīlauea and Mauna Loa and help understand their volcanic activity. Selected time lapses recorded by the USGS are freely available on the Multimedia section of the USGS website. The direct link is here.
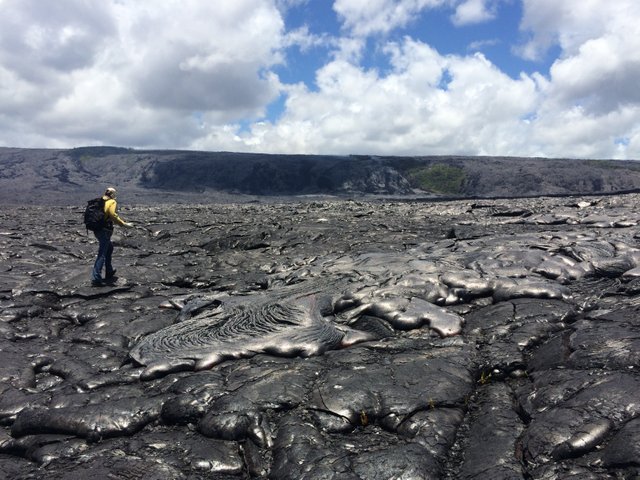
HVO geologist mapping a Pāhoehoe lava flow of Kīlauea.
volcanoes.usgs.gov
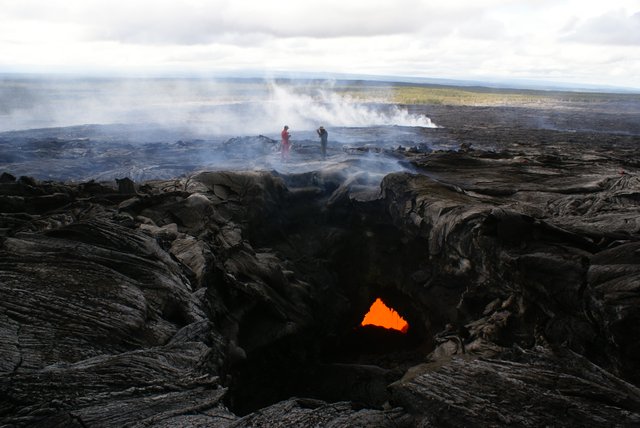
HVO geologists measure the rate of lava flowing through a lava tube.
volcanoes.usgs.org
Additionally the physical changes the volcano itself undergoes are monitored. The first change observable at Hawaiian volcanoes is the inflation (swelling) of the whole volcano. This occurs when new magma is entering the shallow reservoirs causing the surrounding material to stretch. This swelling changes the slope of the volcano. During times of inflation, the slopes of the volcano will become slightly steeper. The inflation before an eruption on Hawaii usually develops slow and gradually over the course of weeks or years. Once the eruption begins, deflating occurs more rapidly, due to the swift release of pressure from the magma chamber.
Sketch of a cross section of a Hawaiian volcano. Additonal magma input into the shallow reservoir results in earthquakes and a change in volcano shape from the dotted to the solid line.
pubs.usgs.gov
This change in slope is not visible to the naked eye. The changes are monitored using tiltmeters, unique pendulum-type instruments to track long-term changes in the ground slope over time. Multiple tiltmeters are installed along the flanks of volcanoes and changes of their position against a fixed reference point are recorded. Tiltmeters are able to detect changes in angles below 0.0001 degree.
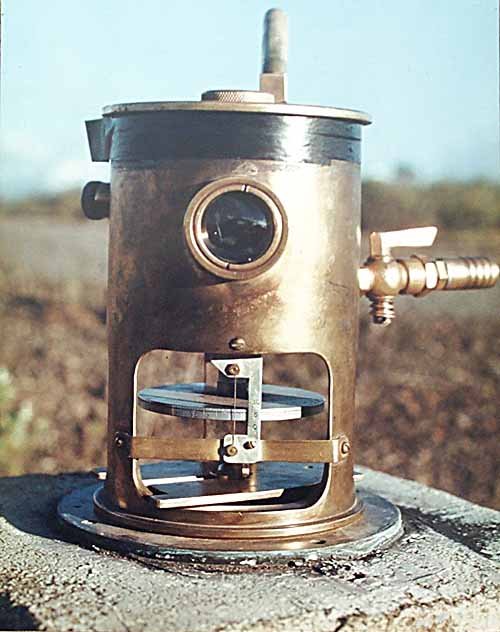
A tiltmeter on Mauna Loa, used to predict eruptions by measuring very small changes in the profile of the mountain.
en.wikipedia.org
In recent years the global positioning system (GPS) is more and more used to observe the ground movements of active volcanoes. High quality GPS receivers are able to identify tiny changes in latitude, longitude and elevation, with extremely high precision. This makes it possible to now observe the complete movement of a volcano. Additionally to the swelling and deflating of the volcano, the GPS data also shows that the southern flanks of Kïlauea and Mauna Loa are slowly moving southeastward (the direction of the sea) on an average speed of a few cm per year. In the future it is possible and very likely that GPS will replace any other ground measuring technique, as data can be obtained around the clock and are not dependent on environmental conditions (e.g., weather).
The newest technique used for volcano monitoring is Interferometric Synthetic Aperture Radar (InSAR). It maps ground deformation using radar images. Satellites send radar signals towards the earth. These signals get reflected by the Earth’s surface and bounce back towards the satellites. Comparing different images over time can then monitor changes in topography. The reason why radar signals are used (instead of visible or infrared light) is that they are unaffected by clouds and therefore do not depend on weather conditions.
InSAR data is interpreted by overlapping data from the same point at two different times. This image then does not portray the surface in general but how the surface itself has changed. InSar has the advantage that it does not require any ground-based transmitters to receive the data. This makes it particularly useful in remote locations where hazardous conditions prevent detailed ground-based volcano monitoring.
Generally, InSAR data covers a wide overall area but the data is collected periodically, whereas GPS uses data that is collected at fixed points, but is transmitting data consistently. The two techniques complement each other and taken together give a great overview on the ground deformation.
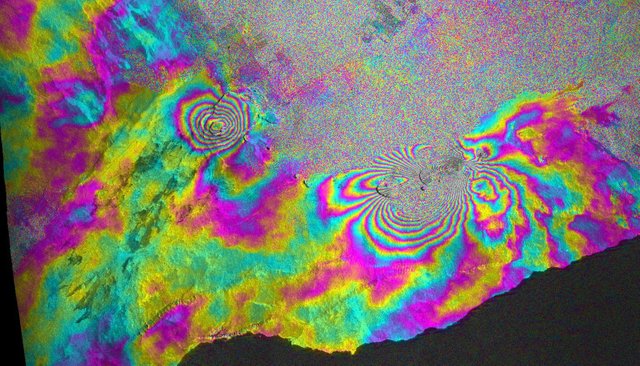
InSAR image produced from overlapping two pictures 35 days apart in 2007 from Hawai’i. The picture shows subsidence at Kïlauea’s summit caldera (left) and a combination of uplift and subsidence at the Makahopuhi Crater (right). The pattern is caused by movement of magma from the reservoir beneath at Kïlauea towards the east rift zone. Each succession of the color spectrum (pink – blue – green – yellow – red) represents ca. 3 cm of deformation. If, moving towards the center, the order of color goes from pink to blue it represents downward deformation. I the color changes form pink to yellow, it demonstrates uplift.
commons.wikimedia.org
The backbone of volcano monitoring is the persistent measurement of seismic activity. Increasing number of shallow earthquakes precedes and accompanies all Hawaiian eruptions. When new magma gets introduced into the volcanoe’s reservoir, the surrounding material is pushed away. This is causing the previously discussed inflation. While the material is being pushed outwards it rubs against itself and ruptures. These ruptures produce seismic waves. A network of seismometers is installed on the surface of the volcano. These seismometers transmit measurements of ground shaking to seismographs that record the intensity of the ground movement via pendulum on a piece of paper. Over time location, depth, and magnitude of earthquakes is recorded, enabling the scientists on Hawai’i to track the movement of magma below the surface. Besides the individual seismic shocks caused by rupturing, all Hawaiian eruptions are accompanied by volcanic tremor. It is a constant vibration in the ground, caused by moving magma. Usually, volcanic tremors are only detected by instruments and only in rare occasions are actually felt by humans on the surface.
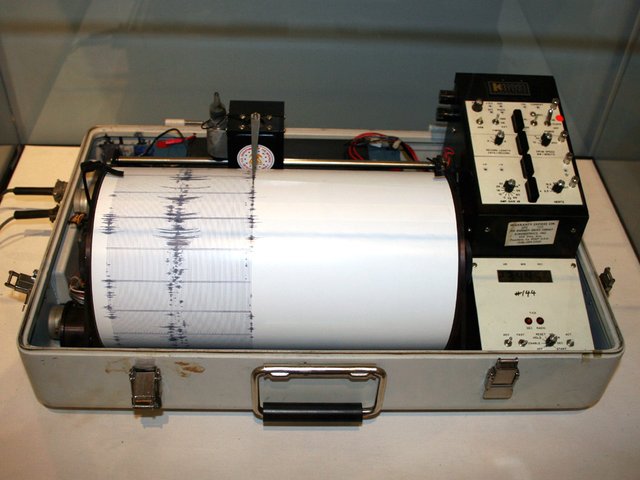
Kinematics Seismograph.
en.wikipedia.org
Common seismic signatures recorded before and during eruptions.
pubs.usgs.gov
Conclusion
A combination of techniques is used to monitor the Hawaiian volcanoes in an effort to understand and predict their behavior. In the field, geologist monitor areal extend of lava flows and effusion rate. Using state of the art techniques, large scale, 3-dimensional maps are created for active Hawaiian volcanoes, monitoring changes not visible to the naked eye. These changes include the inflation of a volcano during the injection of new magma batches as well as their overall movement to the south-east. The last and most vital monitoring technique includes seismic measurements that help monitor the movement of magma underground.
Now that we have discussed all these different techniques, we can, in my next post, look at how effective the geologists at the HVO can predict eruptions to minimize damage and prevent casualty.
Previous Posts
Hawaiian volcanoes - Part 1: Introduction
Hawaiian volcanoes - Part 2: The Hawaiian Hotspot
Hawaiian volcanoes - Part 3: A growing volcano
Hawaiian volcanoes - Part 4: The Rejuvenation Stage
Hawaiian volcanoes - Part 5: Evolution to Atolls and Seamounts
Hawaiian volcanoes - Part 6: Mythology vs Geology
Hawaiian volcanoes – Part 7: Recent eruptions
References
Tilling, R.I., Heliker, C., and Swanson D.A., (2010). Eruptions of Hawaiian volcanoes - past, present, and future: U.S. Geological Survey General Information Product 117, 63 p.

https://en.wikipedia.org/wiki/Seismometer
https://en.wikipedia.org/wiki/Thomas_Jaggar
https://en.wikipedia.org/wiki/Tiltmeter
https://www.usgs.gov/
https://pubs.usgs.gov/ds/621/
https://pubs.usgs.gov/gip/hawaii/page17.html
https://pubs.usgs.gov/gip/hawaii/page19.html
https://volcanoes.usgs.gov/vhp/insar.html
https://volcanoes.usgs.gov/observatories/hvo/
https://volcanoes.usgs.gov/observatories/hvo/hvo_monitoring_deformation.html
https://volcanoes.usgs.gov/observatories/hvo/hvo_monitoring_earthquakes.html
https://volcanoes.usgs.gov/observatories/hvo/hvo_monitoring_geology.html
https://volcanoes.usgs.gov/observatories/hvo/hvo_multimedia.html
You received a 80.0% upvote since you are a member of geopolis and wrote in the category of "geopolis".
To read more about us and what we do, click here.
https://steemit.com/geopolis/@geopolis/geopolis-the-community-for-global-sciences-update-4
You just planted 0.22 tree(s)!
Thanks to @sooflauschig
We have planted already 3362.70 trees
out of 1,000,000
Let's save and restore Abongphen Highland Forest
in Cameroonian village Kedjom-Keku!
Plant trees with @treeplanter and get paid for it!
My Steem Power = 18648.13
Thanks a lot!
@martin.mikes coordinator of @kedjom-keku
You talked about how volcanoes can be monitored through GPS and seismic activity. Is this kind of monitoring done all around the world? What are the chances of a major eruption going undetected while it is building up?
That kind of monitoring is done all over the world. Seismometers are installed at all areas that show active volcanism. GPS is a globally available system and InSAR is provided by space agencies in Italy, Germany, Canada, Japan, Korea, Europe, and the U.S.. But satellite predictions are still far from being a real-time warning system, with days or weeks passing between measurements. Most what is done is monitoring the behaviour of a volcano to issue warnings. That way areas that lie in dangerous areas can be evacuated. But even with all the work done, there are so many factors involved in eruptions. One example of which I know is the 1980 eruption of Mt. Saint-Helen. The eruption was caused by the release of pressure due to a landslide that took away one of the flanks of the volcano. This pressure release triggered the trapped gases to violently expand (much like opening a previously shaken soda can). Mount St. Helens under constant monitoring and warnings had been issued before. But still people died. One of them was the geologist based on the volcano observation station. The whole station got overrun by a pyroclastic flow destroying everything.
Being a volcanologist is one of the most dangerous jobs in the worlds, because it is impossible to predict the exact behaviour of a volcano.
I'm blabbering on, so trying to condense it into one sentence:
The build up might be detected, but the actual moment and extend of an eruption can still very likely be a surprise.
I hope to soon write a more detailed article about the predictions possible on Hawai'i.
Keep tuned :)
I am from New Zealand, so I live on top of a lot of volcanoes. I think we do a lot of monitoring, though not as extensive as you described here. From what you said it sounds like we would get some warning. It would be a huge job to evacuate a city like Auckland, I can imagine some people wouldn't be so keen to leave
New Zealand has amazing geology, and I would love to visit. I bet it is stunning. And your government has an amazing early warning and update system.Definitely have to click myself through https://www.geonet.org.nz/.
From what I've read, only Mount Ruapehu seems to still make trouble, but is not due for another 30 years, so there is time to prepare.
Auckland's time will come.
50-something distinct, single eruption cones located all around the city.
The only question is when will it happen next????
cool post....
Wow, did not know they had so many. Really hope my readings get me to New Zealand at some point.
Yeah cool. It is an interesting topic (and problem as well). Here is some more info here. https://en.wikipedia.org/wiki/Auckland_volcanic_field
Thanks for the great story!
This was a fascinating read @sooflauschig so well researched and written too.
This was refreshing to read and gave me such a lot of knowledge to digest.
Thank you and wishing you a wonderful day 😊
Being A SteemStem Member