The creation of the Excel English Premiership Football Prediction machine.

image by https://objects.kaxmedia.com
I was asked by a fellow Steemit (@carlgnash) to explain how I created the Predicta-Bot. Therefore from now on I will put this introduction into each post containing Predicta-Bot results.
Introduction
When I was studying my part time degree in Philosophy,Politics and Economics I began to realise the power of harnessing and manipulating large sets of data. Studying and analysing statistics in Economics showed me not only what I could do with the data but how I could create my own system to take advantage of the data. Being a fan of football (soccer) I realised if I could find some Excel data on the past football seasons I could not only come up with a fun prediction system but I could also learn a bit more about Excel.I therefore googled "football data excel" and there it was all the seasons in nice downloadable chunks.
The Method
The method I came up to start making predictions was to look at where the teams finished each season and assign them with a number. Having the teams represented was easier then changing the actual team names every season. The example shows how the Premiership table finished last season.
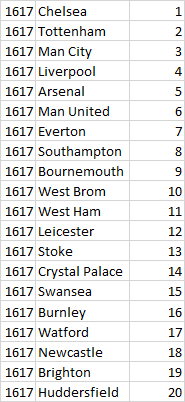
Therefore when looking at the example below you can see that each team has a number which corresponds to where they finished last season.In the case of teams that were relegated they are replaced with the teams that were promoted from the league below. This is filled by spots 20,19 and 18.
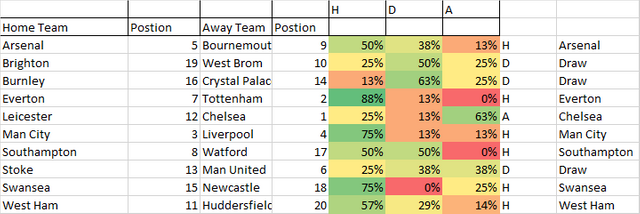
The percentages that are shown represent eight seasons worth of data and what the outcome was when the "team number" played the other "team number". This is shown in the table shown above. When Arsenal (5) who finished fifth, are at home play Bournemouth (9) who finished ninth and are away . The eight seasons of data show that, in the eight times that "5" played "9" 50% of the time the Home Team won , 38% of the time it was a draw and 13% the away team won.
From these percentages Predicta-Bot takes the largest percentage (or when the there are two of the same results , the home result) and spits out the result.
After 10 games I will have two tables alongside each other one that shows the current table and one that has the past table. However I hope for now this all makes sense and we can all have a little fun and put Predicta-Bot to the test.
Have you overlaid the odds you came up with during your research with the actual bookie's odds (current and historical), to find out if your predictive method has an edge?
That is a good idea but I'm sure I don't have an edge I am not that smart this is just some fun. I kind of use the data I get from the results to choose my picks.
It sure would be cool if you could develop an edge though, otherwise, why not just use the bookie's odds to make picks?
Cause thats not fun , hehehehe . I am sure they have nerds with bigger brains there.
hi, what about the points foward and point againts of every team , how do expect goals of every games , just visit 538.com
Great suggestion , in all honesty that sounds like a alot of hard work hehehe . But might try that at some point.
On second thought do you mean look at what bookies have put and then see if there are any gaps . I think the predicted draws are where that will be useful.
Hi @stickchumpion, I have been thinking about doing something like this for the Australian version of football (AFL) but also other types of sports as well, and have to give you credit for actually doing this and learning from the results.
I think it is an interesting hypothesis that you can use team rankings at the end of the year to encapsulate the overall performance of a team and capture key elements/factors that contribute to their final standing, since there appear to be circumstances that can change the fortunes of teams dramatically (e.g. injuries, transfers, retirements, etc). Then again, managers will try to deal with these situations as well so perhaps it evens out.
Seeing some attempt an analysis like this makes me want to do my own as well, especially if it can be done simply with Excel and a little bit of time and effort. I think this EPL season has just gotten more interesting :)
Yea dude Ia keen to get to work on this , I also found some data on the MLS . Holla at me when you abuot
Congratulations! This post has been upvoted from the communal account, @minnowsupport, by stickchumpion from the Minnow Support Project. It's a witness project run by aggroed, ausbitbank, teamsteem, theprophet0, someguy123, neoxian, followbtcnews/crimsonclad, and netuoso. The goal is to help Steemit grow by supporting Minnows and creating a social network. Please find us in the Peace, Abundance, and Liberty Network (PALnet) Discord Channel. It's a completely public and open space to all members of the Steemit community who voluntarily choose to be there.
Cool, very simple method for setting this up and a well written post explaining it all. Resteemed my brother. It might be interesting to just take a look at the correlation between placement in a given year with placement the year before, just to see how good a predictive indicator the previous year's placement is. I am sure there will be a positive correlation, but to what degree? Maybe there are other easy to find/use historical metrics that have a stronger correlation with current success- maybe net goals scored the previous year (goals for minus goals against) as an idea off the top of my head? I know that in the sports I follow (American football and basketball mostly) plus/minus (net score differential) is typically a better indicator of actual strength of team than simple win loss.
I really like what you are doing here with excel and your method for prediction. Will follow