Crypto Contest March 10: Goldfinch
Goldfinch (Coinbase: GFIUSD) has broken out of the triangle pattern in the four-hour chart.
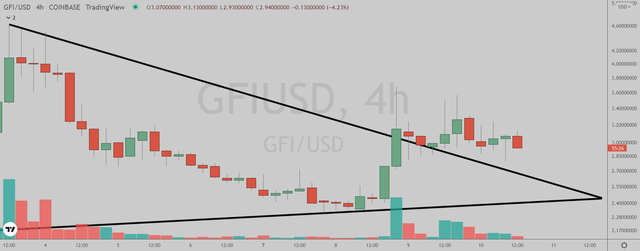
(Chart courtesy of Tradingview.com(log scale))
Elliott Wave Analysis
In Elliott Wave terms, GFI began a red wave one advance on February 24. The red wave one (blue sub-waves i-ii-iii-iv-v) peaked on March 3 and the red wave two (blue sub-waves a-b-c) correction ended on March 7. If this wave count is correct, GFI should be heading next towards the March 3 peak in the red wave three.
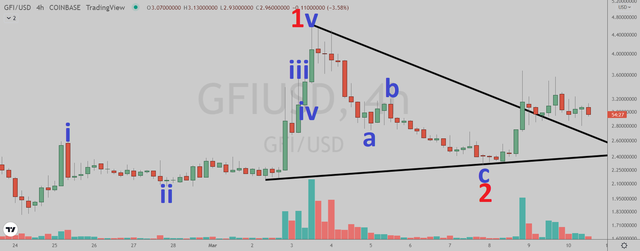
(Chart courtesy of Tradingview.com(log scale))
Funnymentals
Goldfinch is a decentralized credit protocol that allows anyone to be a lender, not just banks. Kalkine Media reviewed the project two days ago.
(Sources: https://goldfinch.finance/)
How Will Goldfinch Trade?
Goldfinch (Coinbase: GFIUSD) four-hour chart by Tradingview.
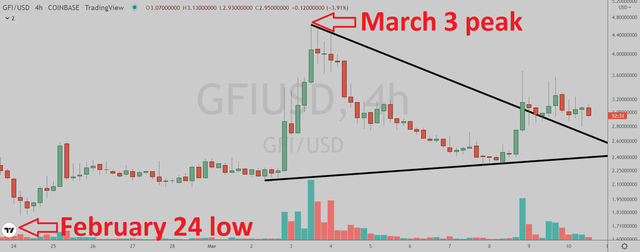
(Chart courtesy of Tradingview.com(log scale))
Prizes
I will be giving upvotes to the correct answers (posts only).
Rules
This poll will expire in one week. Only one vote per person.
Which one will happen first?
Please select one of the three choices and comment below.
GFI will takeout the March 3 peak
GFI will drop below the February 24 low
GFI will stay in a trading range between the February 24 low and the March 3 peak until April 17
GFI will stay in a trading range between the February 24 low and the March 3 peak until April 17
Correct. Upvoted your post:
https://steemit.com/steemit/@simonjay/daily-steem-price-update-16-4-2022
GFI will takeout the March 3 peak
GFI will takeout the March 3 peak
GFI will stay in a trading range between the February 24 low and the March 3 peak until April 17
Correct. Upvoted your post:
https://steemit.com/house/@babangida/living-alone-in-1-1-house
GFI will drop below the February 24 low
GFI will stay in a trading range between the February 24 low and the March 3 peak until April 17
Correct. Upvoted your post:
https://steemit.com/hive-183653/@bgteam/steemit-enthusiasts-community-weekly-report-15-or-sedmichen-otchet-na-obshnostta-steemit-entusiasti-15
GFI will stay in a trading range between the February 24 low and the March 3 peak until April 17
Correct. Upvoted your post:
https://steemit.com/hive-185836/@rosauradels/how-do-i-do-my-home-cleaning-method
GFI will takeout the March 3 peak
GFI will takeout the March 3 peak
GFI will takeout the March 3 peak