Honest Theory of Inflation
I have done a research recently trying to quantify the concept of inflation. We all know what inflation is, the amount by which your purchasing power is diminished in the economy. It's basically a form of theft, resulting from the expansion of the money supply.
Now so far so good, but how to measure it? Obviously the official method will be flawed in order to hide the true inflation amounts. And certain other alternative calculation methods are flawed as well.
The direct effect of inflation is simply the increase in prices, but the inflation itself is the expansion of the money supply. Now of course this definition is not entirely correct either.
Definition
In the Austrian school, this is believed to be true, but I would argue that this is only true if the money supply itself is fixed, transparent, and all transactions are settled in the same system. Like in a blockchain, where Bitcoin is the perfect example. You will have 21 million coins, and all transactions should be settled on the blockchain.
But:
In the real world, we have an undefined money supply, and even the concept of currency is very tricky. The current system is a debt-based system, and every form of debt is a form of asset in somebody's hands, therefore every form of debt is a currency. Therefore anyone that issues debt, creates currency. No wonder most money in the money supply is created by private banks loans (like mortgages, business loans, personal loans) via the fractional reserve system. But not limited to long term loans, all forms of financial derivatives, the market leverage system, and the overnight swaps that amount to "virtual assets" are also creating currency.
M3 Money Supply
So the concept of currency is very hard to define in the current system, but I have tried nontheless. First of all I haven't looked at the money supply, since of course theoretically M3 would encompass all assets and therefore give us an accurate number for the inflation. Now interestingly the M3 is not published anymore in the USA, but it doesn't even matter because the M3 has no impact on inflation, my research has found. Some of the M3 assets are just "virtual" assets like overnight repos, while others are money market funds and large term deposits, which are held for a very long time.
So think of the M3 like a large dumpster where everyone dumps their big stack of cash to earn some small interest on it, because investing it in smaller markets is a guaranteed loss, they might not make money since the interest doesn't cover the inflation, but they are losing less money than otherwise. So it's a huge dumpster, most of that money will probably never move from there. And unless that money is spend, it doesn't matter from our inflationary point of view.
Like if you have 100 trillion $ dumped into MMF's that will probably never move, has absolutely no impact on the purchasing power of your grandma. It might help you forecast inflation in the future, if some of this money would move, but it has no impact on the present. Therefore unless somebody takes this pile of money and buys groceries with it, it's unlikely that your food prices will be affected by this.
The CPI
Alright, so it's not the M3, because most of the assets are just too longterm to have any impact on the current economy. So what about the official CPI based inflation rate.
Well the problem that I have with the CPI , there are many, is that it just takes all prices from a chosen basket, and it computes the arithmetic mean of it. Now what kind of bullshit method is that?
Are you telling me that the hair-pin prices have an equal weight importance in inflation as gold prices? Given that gold is a 7.5 trillion market and hair-pins are maybe a few million.
Nope it should be weighted by trading volume, but of course that is impossible to determine on all markets, so it stinks from the beginning.
And also the CPI doesn't cover many markets like the Stock Market, Real Estate, etc... It only covers consumer prices, hence the name, but the consumer prices are not just what people buy.
So the CPI data as it is, is just a piece of trash, totally useless, and since every single Government is measuring it's own inflation using this method, this should tell you something about their honesty.
Dilemma
So it's not M3, since that is too broad, and not CPI since that is too narrow, and also flawed, so the true inflation is somewhere inbetween. Now we could analyze M2, but it's not M2 either. And M1 is also too narrow, so the true inflation is somewhere between M1 and M2.
So you have to rethink the definition of inflation. So if I have 1$ today, which which I can buy a fraction of certain things today, how much can I buy with 1$ of same values things as today, but tomorrow. And keep in mind that prices could change for other reasons too. So it's a dynamic problem, but not impossible to resolve.
The Optimal Theory
So we have to look at what inflation should be in an optimal economy. In an optimal economy that would run on Bitcoins, where every single transaction in the world would be denominated in BTC, it would be pretty easy to do economics.
After the 21 million supply is reached, prices would stop growing. That's it, prices would no longer grow, in aggregate.
Sure there would be supply/demand imbalances in certain markets, but the prices, in aggregate (if a real TX weighted CPI would be invented would indicate that) prices would go down.
So prices would go down, wages would go down, and the value of Bitcoin, would represent a growing economy, since the value of Bitcoin would go up versus all other assets since BTC would the only global currency.
This is what economic growth really means, prices and wages going down. Deflation is economic growth.
It makes total sense, since take the tech industry, PC & phone prices are going down, despite the inflation, so it's expanding massively. But the government tells to you that deflation is bad. Gimme a break.
GDP
This is where the big scam is. The GDP doesn't measure the size of the economy, what it actually measures is the correct inflation rate.
Because as I said, in an ideal economy, the economic growth is measured by prices going down, so if the prices are going up, that means that there is inflation, but we don't know anything about the economy unless we consider TX volumes as well.
Another thing is that GDP doesn't measure the quantity of items, but their produced quantity in $. So that is the inflation itself. If you were to measure the economy you might want to multiply this with the quantity of items produced.
So yes if we make 10 TVs for 1000$ this year but next year we make halfe less for double the price, then the GDP will double, but the actual economy haven't increased at all.
So in a micro economy if we manufacture:
| This Year | Next Year | Change |
|---|---|---|
| 10 TV for 1000$ | 5 TV for 2000$ | Then the GDP shows you a 100% increase |
| However the real economy haven't increased at all |
So the GDP is actually useless to measure the size of the economy ,however what it really measures is the inflation rate, because it shows you that the TVs have doubled in price.
Funny isn't it? How misused the GDP is. And also the GDP doesn't have the additive issue with the arithmetic means, since it adds up currency quantity values not averages, so it doesn't have to be weighted by transactions.
The Inflation Itself
Now there are 3 different forms of the GDP, which should measure the same thing, but due to measurement discrepancy they differ a little.
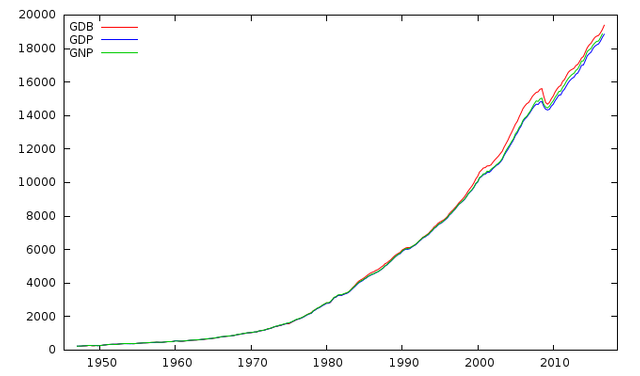
You have the GDP, the GDB and the GNP that should measure the same thing, but they differ a little. So I just use the GDB instead, simply because it has the highest value, and it's better to overestimate inflation, than to underestimate it.
So the inflation rate is the difference between 2 points in the data, i prefer to use a LN difference since it's easier to work with. I have also compared the GDB with the other money supply indicators and as you can see:
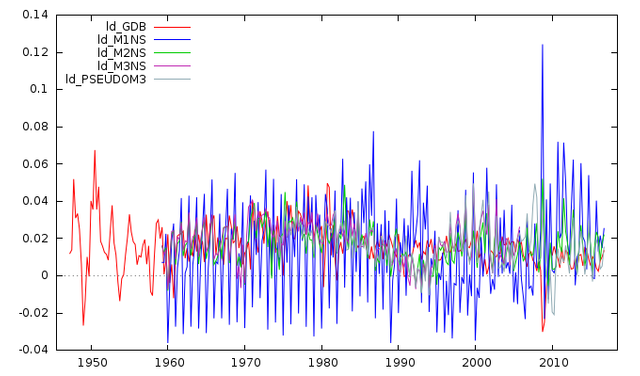
The M1 is pretty volatile, since it's mostly cash, therefore it comes and goes, sometimes negative sometimes positive. The Pseudo M3 is the M3 that I have estimated and it shows the highest value, but as described above, most of it is irrelevant to the economy, while the GDB is between the M1 and M2 usually. Interestingly there was some deflation in 2009 due to the crisis. And keep in mind that this is quarterly data, so yes in the 50's you had a ~ 28% inflation rate.
| Indicator | Mean |
|---|---|
| ld_GDB | 0.015861 |
| ld_M1NS | 0.013834 |
| ld_M2NS | 0.016585 |
| ld_M3NS | 0.019038 |
| ld_PSEUDOM3 | 0.016471 |
You can see that the mean inflation rate is about 0.0158 or 1.58% quarterly so it's about 6.3444% yearly, in log percentages, or 6.54998% is decimal percentages. Your purchasing power is most likely diminished by this factor, every single year, in the USD. Meanwhile the "official" CPI says that it's only just 2%.
You can just get the GDB data from here to work with:
Sources:
https://pixabay.com


Well done.
I think GDP overstates inflation by the volume of transactions perhaps per capita GDP would be better. That would still be a little high. Perhaps we should clauckate transaction increase by using a basket of commodities and how much the volume increased in a year. A basket of steel energy agricultural commodities.
To back out price you could use gold to weight berthing. Convert Peru to units of gold. And look at commodity growth in oz of gold. Gold ratios are how Adam smith did Econ.
No it's the GDB not the GDP.
And it's the % or log difference between 2 points, in this case the GDB data is quarterly, so 1 point is the inflation for 3 months, so 4 points amount to yearly inflation rate.
GDP per capita is useless, it's tied to population growth, which doesnt matter from the economic point of view.
You havent read my article or havent understood it, a basket of goods is flawed from the start, because it needs to be weighted by transaction volume, which is impossible to measure since most TX are done in OTC, not in centralized exchanges.
Nobody can quantify how many tomatoes are sold in a country, maybe it's possible, but I have no such data.
Secondly you need to consider all markets. Well the GDB already does this, it just adds up all purchases, done by corporations, banks and individuals, so the all or most purchases are included here. It's probably calculated very thoroughly, that is why it takes 3 months to do it, and it's usually cross correlated examined with IMF, World Bank , and other economic organizations who calculate the GDP/GNI/GDB on their own, so I guess it's a pretty accurate number.
The gold standard benchmark is not good either, since the gold transactions make up a very tiny fraction of the economy.
I chosed USD since it's the most transparent and well documented currency by many organizations and the GDB since it's the highest value, so that we can overestimate inflation instead of underestimating it.
How is GDP measured in your scenario here? We have 5 products at $2000 each vs. 10 products at $1000 each and you say the GDP differs by a factor of two.
I find this M3 stuff over my head, by the way.
I dont understand your question.
I meant to ask what your formula was for calculating GDP?
I understand what your are implying, I think I made a mistake in the article. I will have to revise the theory.
Yes the GDP in the TV example was calculated incorrectly, GDP = ∑(output * price).
It still doesn't measure the economy, since I think the price alone , a deflating price, should be the indicator of economic wellbeing, while the output doesnt matter.
However it doesnt measure the inflation as accurately as I wanted to do, it still overestimates the inflation, so the inflation should be something a little bit lower.
Let me think about it more and I will do a revision.
What is actionable about this?
What do you mean?
I have access to the public markets (Wall Street), US Dollars, Bitcoin, Steem, Steem Power, and Steem Dollars. What does your theory on inflation say about how I should invest my assets? Is not your theory backward-looking?