RESEARCH: Measuring Absolute Wealth [4] - Quantifying Inflation

I have made a lot of progress with my research, and for it to continue we first need to quantify inflation.
Read previous parts:
- https://steemit.com/money/@profitgenerator/research-measuring-absolute-wealth-1
- https://steemit.com/money/@profitgenerator/research-measuring-absolute-wealth-2-value-theory
- https://steemit.com/money/@profitgenerator/research-measuring-absolute-wealth-3-basic-logic
I have successfully discovered the true definition of inflation, and found the best metric to measure it. The problem is that both the Austrian School definition and the Keynesian Theory definition is wrong.
The Keynesian approach is from the price increase measurement, which is too broad, and the CPI is probably not weighted by volume, so that metric is totally useless. (After all you can't equally add a meat market and a coal market when their volume difference is too big). But the Austrian definition as being the "printed money", the increase in the money supply is meaningless, in an open monetary system like this. If it were closed like Bitcoin, with a hard limit on the supply, then it would be another story, but there are too many short REPO's and other virtual loans/assets that come and go, therefore simply measuring the money supply isn't correct either.
INTRO
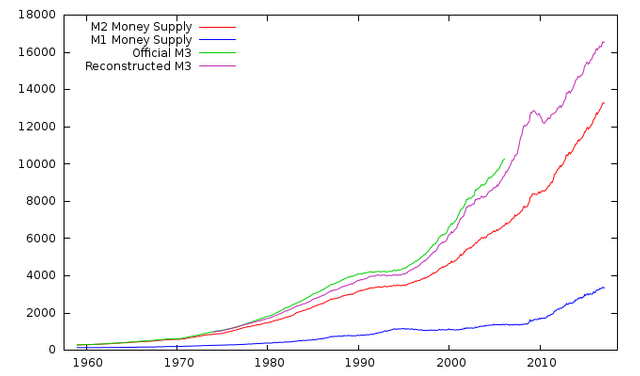
Now there are 3 different money supplies: M1, M2, M3
I am working with US data since my measurement will be based on the USD. Now you would say that M3 is the money supply, therefore any % increase in that is the inflation, and the FED actually stopped publishing the M3 data in 2006, so there might be some conspiracy there that they are trying to hide the money supply.
This is actually not true, while it may look like they are trying to hide M3, in reality, M3 doesn't even matter in the slightest. I have actually reconstructed the M3 to a 99.9511 % accuracy, and there is nothing shady going on there:
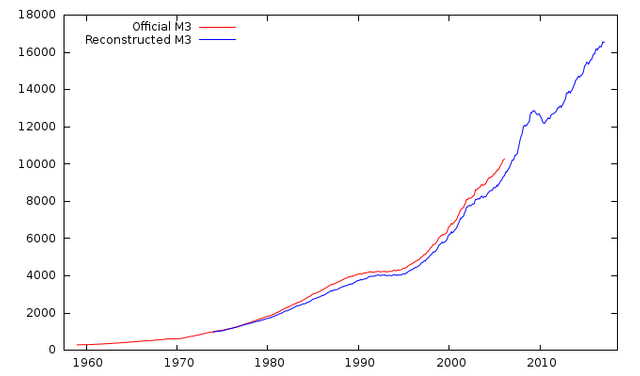
So to compare them we take the log difference of each and then we get the following fractional numbers at each (monthly):
| Official M3 | Reconstructed M3 | M2 | M1 |
|---|---|---|---|
| 0.0063023 | 0.0054698 | 0.0054878 | 0.0045291 |
And yes while M3 shows the highest inflation, the actual "inflation" occuring at the M3 assets, has absolutely no impact on the economy whatsoever. Most assets there are virtual assets, that are just swapped back and forth between banks and central banks. It hardly affects the purchasing power of individuals or corporations.
I have analyzed hundreds of datapoints from the FED and the World Bank, trying to find some relationship between the M3 inflation and the broad economy of the US, and I have found only weak links. It may affect banks, but it has little impact on the economy. So the FED just took the data out due to irrelevance, and not for some conspiracy.
LOOKING FOR ALTERNATIVE
So analyzing many indicators (sales,income,production,trade,consumption,etc...) I have found more impact on the economy from M2 money supply, especially it's savings part, highest correlation giving this data: NOM1M2N, which is M2-M1. Now this is strange, because you would think that M1, being the liquid currency, would have the biggest impact on prices, and not M2, certainly not the illiquid parts of M2.
Well it's true because we should also factor in that most money is not held in grandma's hands, so the inflation won't be seen in tomato prices, but in corporate and banking sectors, which means the non-liquid part of M2.
But this kept me thinking, and I had to think about this for days, since I found this so strange, that I was confused. I didn't know what inflation was, nor I suppose anybody else does for that matter. All these economists who think they are smart, have no idea what they are talking about.
So I figured something was wrong with this, especially with the definition of inflation and the perspective of it.
WHAT IS INFLATION?
Now we need a clear definition for inflation. The change in CPI doesn't cut for it, it measures price baskets incorrectly, and there are many more garbage indicators on the FED's site, that have little correlation with the economy.
So I did a 180 degree turn and started assuming that inflation was spending itself, because in an inflationary economy, with open money supply, the spending itself is the inflation.
So I looked at the PCE data, and quite shockingly it had a better reflection than M1 or M2, but why stop there. If spending is inflation, then we should look at income. So I stopped at Personal Income, more specifically Disposable Personal Income, which is after taxes.
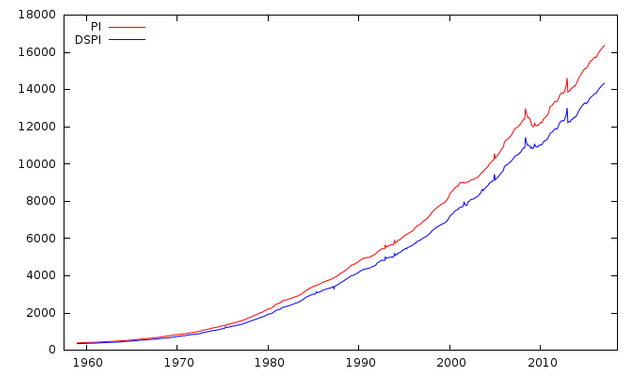
So the DSPI is interesting, it had the highest impact on the economy, since it's not just what people spend but also what people save, which makes up the savings part of the M2. In fact the DSPI suggested a much higher inflation level than M1 and M2, because it's not just the monetary supply, but also the debt is somewhat reflected in it. And the consumer price index is a bogus measurement tool, it is the next best thing to look at.
And it makes sense, people earn money, and they spend it. Their earning is also inflated, with inflated prices, so their purchasing power is either lower or the same as before, and inflation can be measured in income too.
THEORY OF INFLATION
So if the entire system is inflationary, that actually shows that nothing is growing. Let's that sink in for a moment. There is no actual economic growth via currency, only the numbers are changing.
What we call economic growth, in the real economy, would actually mean just the complexity of the free market, but no actual expansion. Think about it, if we actually had a global fixed supply currency to measure the economy in, there would be no growth, only the prices would go down.
Real economic growth is actually deflation, since as the market is getting more complex due to competition and serving the demand with supply, the prices go down. The bigger the market, the more the competitors, and the cheaper the prices.
The tech industry has been booming, and prices are only going down, so price decrease IS economic growth, and the GDP is actually the inflation.
Because in this economy the scale is flipped, the economists don't measure economic growth with the GDP statistic but the decrease in purchasing power. The GDP measures the goods and services produced in a country, but not by their quantity, but by their $ value.
Well what is that if not the inflation itself? Because you don't measure the quantity of good and services, nor their quality, you are measuring how 1 industry is growing in price, which is the inflation itself.
ACTUAL INFLATION
So therefore, I have actually determined after many hours of research that the actual metric of the inflation is the domestic production in $. Because as I said, this metric is foolishly used to measure economic growth, which it doesn't, in fact it actually measures the true inflation.
So going with the analogy above, the income of the whole country is the inflation itself, because in the true economy, incomes never grow, only prices go down, so your purchasing power is what should grow, and not your numerical income.
So if the income in a perfect economy is stagnant (or changing in a zero sum mode), but certainly not growing in aggregate, this means that if income is growing in aggregate, thats just the money printing itself.
I have determined after a lot of analysis that the GDB metric is reflecting the true inflation to it's fullest extent (not to confuse with GDP). The GDB is Gross domestic purchases.
According to the National Bureau of Economic Research it's calculated by:
Gross domestic purchases is the market value of goods and services purchased by U.S. residents, regardless of where those goods and services were produced.It is GDP less net exports of goods and services; equivalently, it is the sum of PCE, gross private domestic investment, and government consumption expenditures and gross investment.
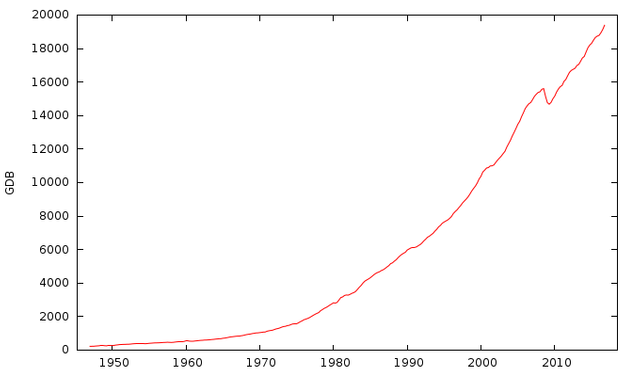
The unit of measurement is meaningless, what matters is the difference between 2 points. The data is quarterly, therefore the difference between 2 point is the inflation of 3 months of the USD.
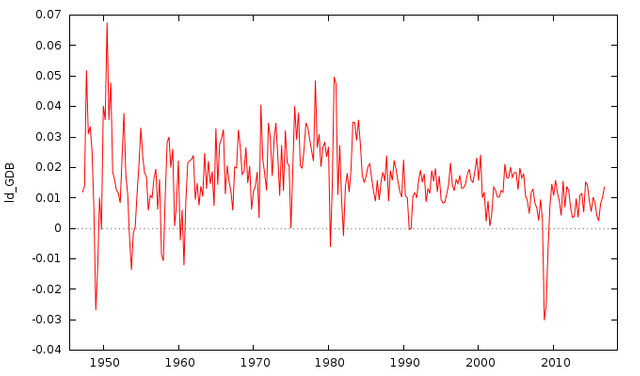
It had a quarterly average difference of 0.015861, and an expectancy of 0.015147 , which means that you should expect an inflation of 1.5262% quarterly or 6.1049% yearly with the USD.
That means that if you are investing in shitty bonds with 2-3% returns, you are likely to lose money since the true inflation is double of that.
I have compiled a dataset (.csv) of the inflation rates of every quarter since the start of the data, so that you can see how much true inflation there was:
You may notice that the inflation is in log form, since the percentages can't be added together. So if you want to calculate the inflation rate in a period say 2 years. Then you need to add together the log values, and then convert it to percentage
To convert log values to percentage, you simply raise that number to the 2.7182818284 power, which is the e constant, to convert percentage back to log form, just apply the natural logarithm, which in Excel would be like
=LN(number).
CONCLUSION
Now that I have discovered the meaning of inflation, I have now half of what I need to calculate the absolute wealth. Once variable is the inflation, while the other is the price mechanism of the market, which spans internationally. Therefore we will be looking at the absolute value of the USD in the forex market, which is another tricky puzzle, since there are problems with this too.
However by knowing the inflation rate, we can already estimate the internal value of the USD, so if the USA would be an Autarky, which it isn't, then only the domestic inflation would matter. But if the country is heavily engaged in trading, especially imports, then we need to look at the international value of the USD. This will be another research for another time.
Sources:
https://pixabay.com
https://fred.stlouisfed.org
http://www.federalreserve.gov
http://data.worldbank.org
U.S. Bureau of Economic Analysis