Ethereum is in a falling wedge, but is the bullish pattern enough to give us hope? | Price Analysis: Ethereum (11/7/2018)

Background & News
Ethereum (ETH) has been the leading force behind the previous Altcoin seasons considering that it is currently at almost half of Bitcoin's market capitalization and has been one of the front movers of cryptocurrency adoption.
Ethereum has just recently been chosen as the only cryptocurrency to be adopted by Opera's new crypto wallet within the Android browsers and has been chosen as a major part of the portfolio of several cryptocurrency funds recently including Multicoin Capital and a16z.
One of the biggest questions of Ethereum is currently the way of scaling. Since Ethereum is a dApp platform and a decentralized supercomputer mainly, the network needs to handle thousands if not millions of users in theory to gain proper mainstream adoption for the applications running on its network. Even though Sharding and Plasma have been proposed, there is no definitive answer yet to the urging problem: scaling while keeping decentralization at the needed levels.
Future Ethereum releases might include Serenity, which will transition the network to either Proof-of-Stake or a Proof-of-Stake/Proof-of-Work Hybrid.
Charts
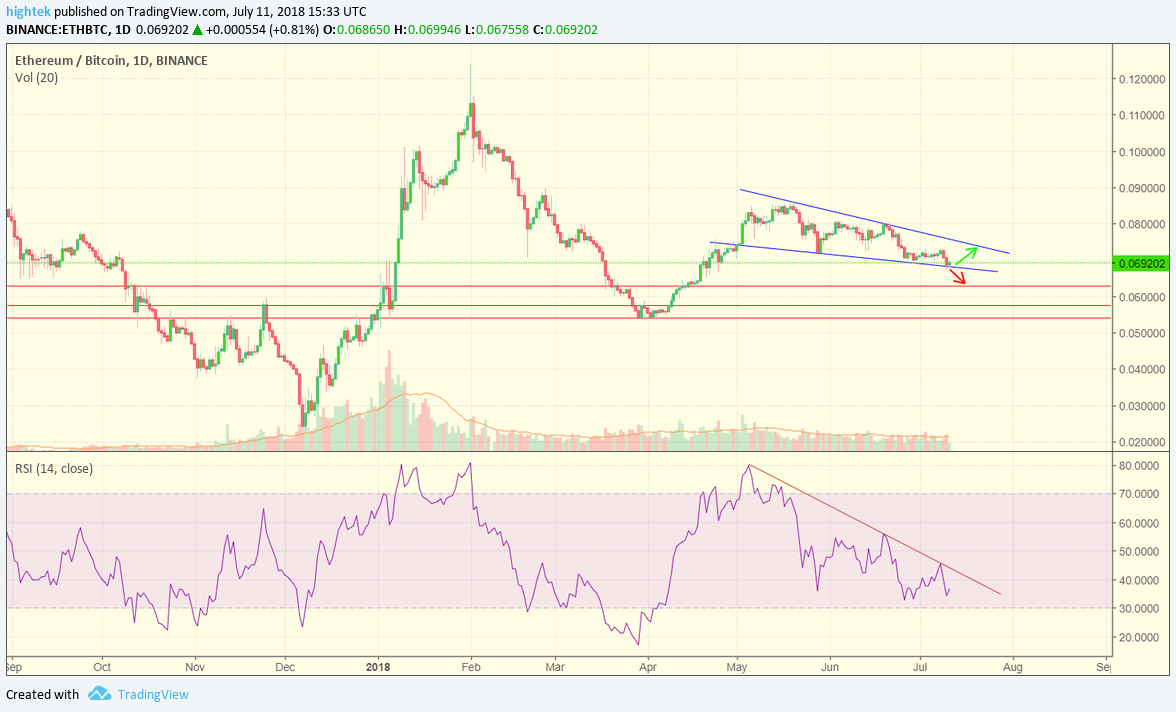
The BTC/ETH chart gives us mixed feelings and there is no definite direction even though the pattern seems bullish. Firstly we have a falling wedge (blue) and the current location of the price has been at the bottom of the pattern.
The bad part is that the volume doesn't indicate either a capitulation or strong buying at these levels. The current bounce from the bottom line has been weaker compared to the previous ones making us think that we will break below the pattern. If we break below and reach a 0.067 BTC price on a daily close we have a great shorting opportunity towards on of the previous resistance/support lines (red) that might act as a bounce zone with the first one being at 0.0628 BTC. RSI (orange) has been falling lately as well, but it didn't hit the oversold territory.
In case of a bounce, we should be confirmed above 0.0707 BTC for a long opportunity.

The BTC/USD chart doesn't raise much confidence at the moment, the previous bounce has been denied at the long term declining trend line (pink), but we are still in a historical accumulation/bounce zone (orange), which means that there is a good possibility for a profitable long if we drop further or keep the price.
A break of the long term trend line could also give a great long opportunity, while the next denial could be an extremely good shorting opportunity.
@hightek gave you an upvote on your post! Please give me a follow and I will give you a follow in return and possible future votes!
Congratulations @hightek! You have completed the following achievement on Steemit and have been rewarded with new badge(s) :
Click on the badge to view your Board of Honor.
If you no longer want to receive notifications, reply to this comment with the word
STOPDo not miss the last post from @steemitboard:
SteemitBoard World Cup Contest - Semi Finals - Day 1
Participate in the SteemitBoard World Cup Contest!
Collect World Cup badges and win free SBD
Support the Gold Sponsors of the contest: @good-karma and @lukestokes