Do It Yourself: My Cryptocurrency Dashboard
I know, trackers for crypto portfolios are a dime a dozen. Some of them with an overwhelming functionality, others more simple and straight forward. I recently read an interesting overview by @pedrombraz who presented his top 10 ways to track your cryptocurrency. However, what all of the presented ways have in common is that they are 3rd party services and hence further "data hunters" waiting or me. This, as well as my inner urge to code again, motivated me to develop my own cryptocurrency dashboard.
This article will neither be an tutorial on how to code your own cryptocurrency dashboard, nor an in-depth technical description of what I did. If you want to know more about that, visit the github repository and have a look at the readme and the source code. In the following I will only briefly present the functionality of my dashboard. Furthermore I want to know about your ways to keep track of your portfolio and have some questions for you in the end.
Please Note:
| What I am not | What I am | What not to expect | What to expect |
|---|---|---|---|
| Developer | Python enthusiast | A bug-free, full-fledged trading tracker. | A quick & dirty, hands-on approach that fits my needs. |
| Trading-Expert | Owner of a handful of altcoin | The revealing of the hidden performance indicator. | Some graphs and numbers that might or might not be helpful. |
A Brief Plunge Into The Coding
The dashboard is written in Python. I used the dash framework (for the first time) to build the web-interface and plotly for the visualization. A shout-out to these awesome open-source projects!! The current crypto prices are pulled from coinmarketcap via their API. All data is stored in an sqlite-database.
So all this program is doing is setting up a server on your machine, doing some calculations and spitting out some coloured graphs and numbers to any browser you like. Everything is published under GNU Public License, so go and get it and do whatever you want with it!
The Functionality
Add A New Purchase:
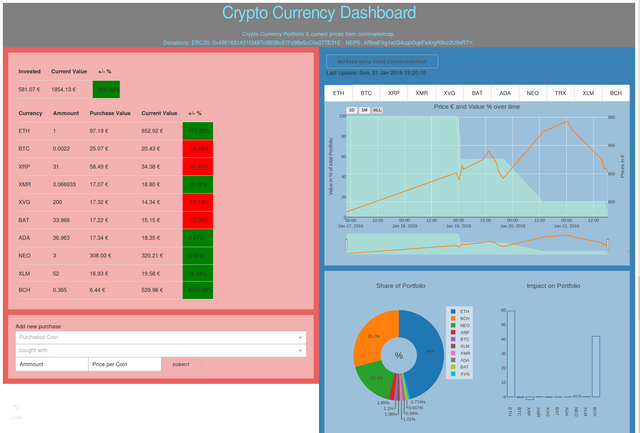
First things first. To have something to track, you need to add it to your portfolio. This can be done with this form.

The purpose of this dashboard is to track the performance of your coins in relation to the fiat money you've invested. This means, the first purchase you add has to be a cryptocurrency that you bought with fiat money, in my case Euro. Further purchases can be made by fiat or by a coin that you have in your portfolio. In this case the purchase value in € will by calculated by how much you've paid for the respective coin.
The Tabulated Overview
Pretty much self explaining. The uppermost table summarizes all investments and the current value of your portfolio. The big table gives you a more detailed listing of how much of which coin you own and how they perform.

A Tab For Every Coin
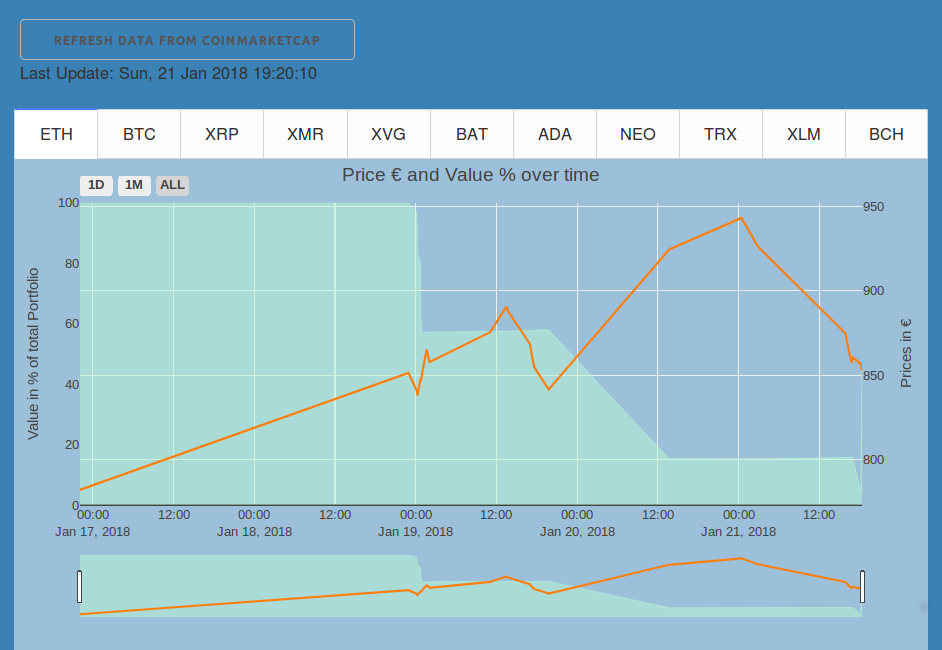
In the right column of the dashboard, the more interesting stuff is going on. On the top you can see a tab for every coin you own. Under each tab you can find the prices in € over time, as well the percentage of your asset that the particular coin adds up to.
In this example you can see, that Ethereum made up 100% of the portfolio in the beginngn. Than other coins were bought with it, so the share of the value of the portfolio decreased, even though the price of Ethereum increased during that time. Maybe not the cleverest time to exchange ETH for something else?!
Even More Graphs
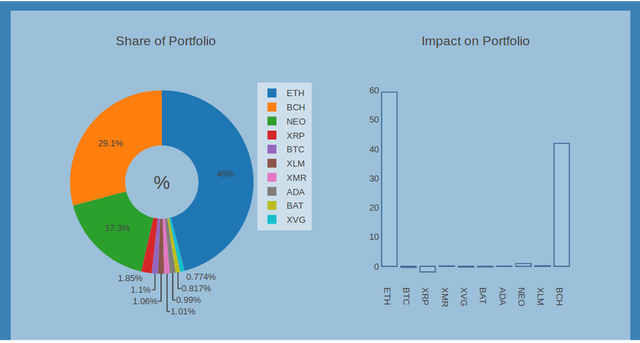
Since it is so easy to create beautiful graphs with plotly, I had to add some more. On the left side you can basically see what the blue-green-ish graph from the previous section shows for every individual coin, but aggregated and only for this particular moment in time - or the particular moment when you last updated the coinmarketcap data. It tells you which percentage of the current value of your portfolio is made up by which of your assets. While I think this is a interesting thing to know, I'm not quiet sure about the graph on the right side ...

My idea was to have an indicator to show how much each individual asset contributes to the decrease or (hopefully) increase of the value of your portfolio. So it takes the absolute change in the value of an asset and divides it by the absolute change in value of your portfolio. And well... it serves its purpose. In this example you can see that while BCH had the highest relative increase in value (see overview table), Ethereum had the biggest positive impact on your portfolio value. Meanwhile Ripple had the biggest negative impact - screw you Ripple! However, I have the feeling that there are better indicators to rate the individual performance of an asset. Would it be more insightful to calculate for each coin, how much the portfolio would be worth if you would have invested everything into that coin? I don't know... This leads my to the last section:
My Questions For You
- How do you track your cryptocurrency portfolio?
- What other indicators and graphs might be useful in a dashboard like this? What does your portfolio tracker provide, that this one doesn't?
- How could I measure the performance of an individual asset compared to the overall performance?
... and more general:
- Do you think it is worth it to develop your own dashboard, when there are so many others out there?
- Would you be interested in using this particular dashboard? (Maybe in a version 2.0)
- Would you be interested in an tutorial on how to developed something like this?
- And is there anyone out there who is into plotly & dash? I would have tons of questions for you my friend;)
This should be it for my first Steemit post. I hope some of you enjoyed the reading. I am grateful for every question, answer and critique in the comments. Also, if you like, visit the github repository give me feedback on the code or use the dashboard yourself.


Good luck in your new project. =) If you have some question about develop, maybe I can help.
Thanks muselew! Do you have experience with plotly and dash? They are the libraries that I'm most unfamiliar with.
Nops, however I gonna see here if any of my friends know. Just to jump some steps, what is the question?
Cheers mate! One question is, how do I re-render the application-layout with all the graphs, without having to reload the page? For example after the coinmarketcap data is refreshed..
Congratulations @elpunkt! You have completed some achievement on Steemit and have been rewarded with new badge(s) :
Click on any badge to view your own Board of Honor on SteemitBoard.
For more information about SteemitBoard, click here
If you no longer want to receive notifications, reply to this comment with the word
STOPCongratulations @elpunkt, you have decided to take the next big step with your first post! The Steem Network Team wishes you a great time among this awesome community.
The proven road to boost your personal success in this amazing Steem Network
Do you already know that awesome content will get great profits by following these simple steps, that have been worked out by experts?
Congratulations @elpunkt! You received a personal award!
Click here to view your Board
Do not miss the last post from @steemitboard:
Congratulations @elpunkt! You received a personal award!
You can view your badges on your Steem Board and compare to others on the Steem Ranking
Vote for @Steemitboard as a witness to get one more award and increased upvotes!