Crypto-Education Series Episode 13 [EN-TR]
Ichimoku Kinko Hyo
- The indicator was developed by Goichi Hosoda and published in the late 1960s.
- Ichimoku shows support and resistance levels, current momentum and trend ways of the assets.
- It consists of 6 components.
 winnersedgetrading

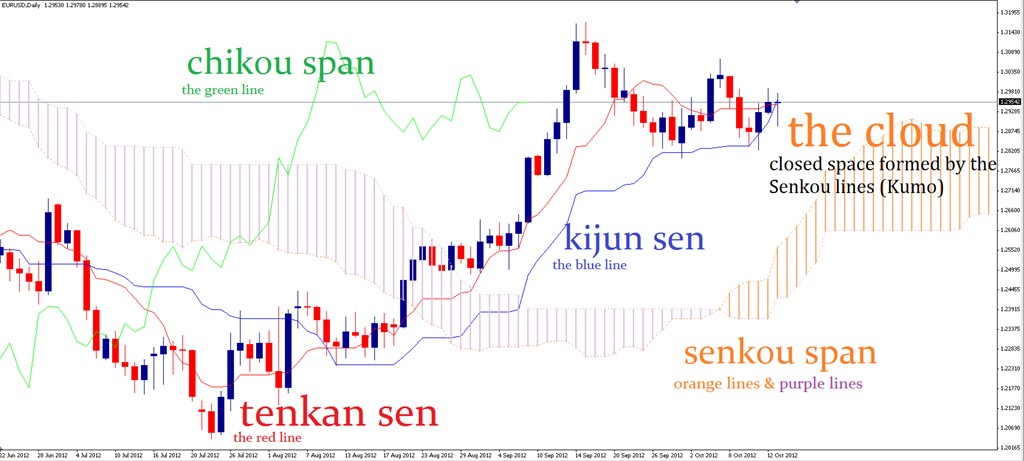
6 components of Ichimoku
- Kijun Line
- Tenkan Line
- Chikou Span
- Senkou span A
- Senkou span B
- Kumo-the cloud-. bordered between Senkou Span A and B.

Calculation of 5 components
Tenkan-sen = (9-day high + 9-day low) / 2
Kijun-sen = (26-day high + 26-day low) / 2
Senkou Span A = (Tenkan-sen + Kijun-sen) / 2
Senkou Span B = (52-day high + 52-day low) / 2
Chikou Span = Close plotted 26-days in the past.
Investopedia
algorun
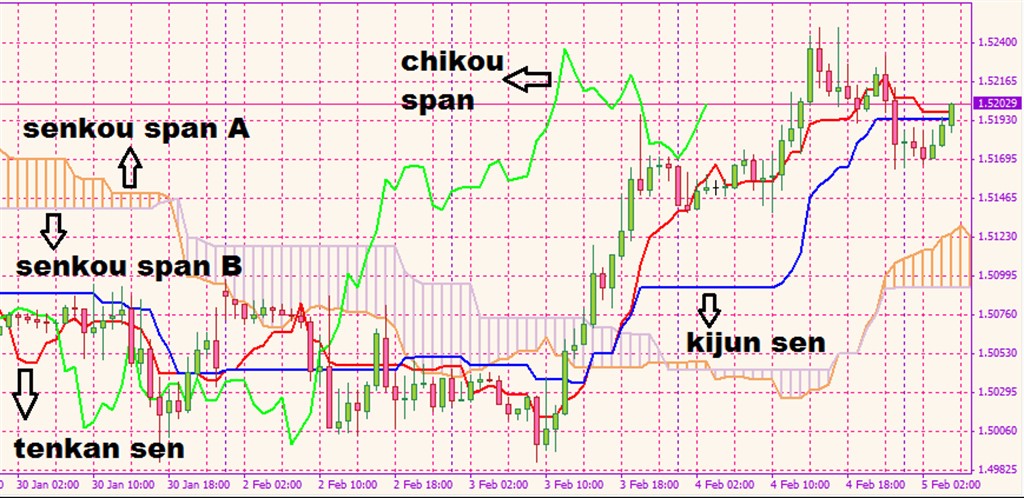
Senkou
- Senkou Span A and B serve as a support and resistance depending on the position of price action.
If the price is above the Senkou span, the top line serves as the first support level while the bottom line serves as the second support level.
Conversely,
If the price is below the Senkou span, the bottom line forms the first resistance level while the top line is the second resistance level. Babypips
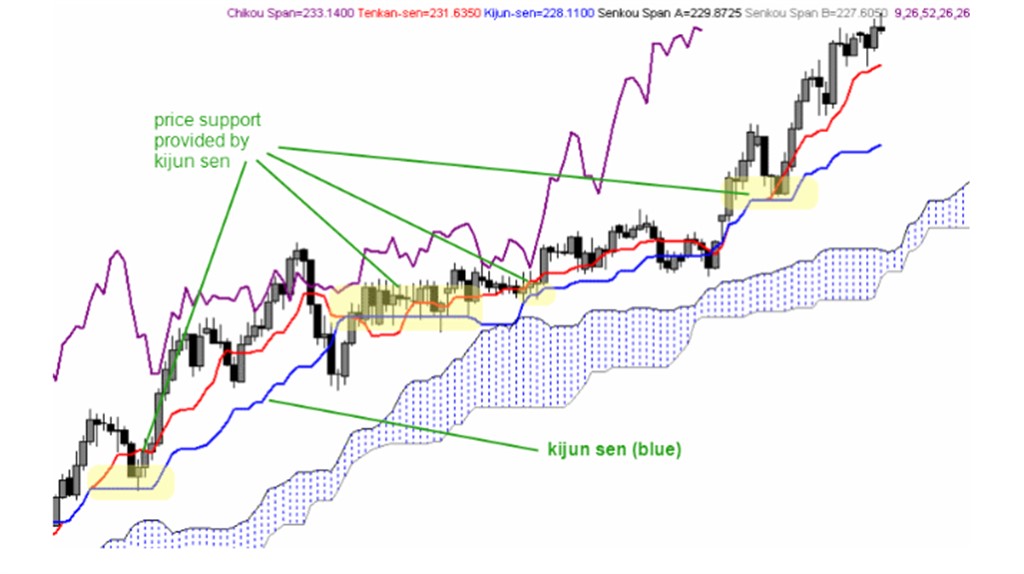
Kijun Sen
- Interpreted as an indicator of future price action.
- Kijun Sen comes behind the Tenkan Sen and trails price less sensitively as it consists of a longer period of time.(26)
- When Tenkan Sen crosses above Kijun Sen, this is taken into consideration as a bullish signal.
- When Tenkan Sen crosses below Kijun Sen, this is taken into consideration as a bearish signal.This is called as T-K Strategy.
 tradingcermat

Tenkan Sen
- Interpreted as an indicator of the current market trend.
- Generally, it is consulted to predict the possible future momentum. Once the Tenkan Sen line moves above the Kijun-Sen, it is picked up as a bullish signal.
 Indian-forex

Chikou Span
- In another word, "Lagging Span".
- It helps traders to visualize the relationship between current and prior trends.
Most Ichimoku Kinko Hyo strategies use the Chikou as a momentum indicator and secondary confirmation tool based on its relationship with the other four Ichimoku lines – the Tenkan-Sen, Senkou A, Senkou B and Kijun-Sen.
Investopedia
Conclusion
- Ichimoku is one of the most challenging indicators to interpret. Each one of the components serves a critical information for your future price predictions.
- As the indicator is used by many traders, it has a great validity, especially in cryptocurrency. Traders should use Ichimoku with some other indicators to have a better vision in the market. Ichimoku is often paired with the RSI, to confirm the momentum in a certain direction or The colored MACD indicator can also be used to confirm the momentum.

Crypto-Education Series Episode 1
Crypto-Education Series Episode 2
Crypto-Education Series Episode 3
Crypto-Education Series Episode 4
Crypto-Education Series Episode 5
Crypto-Education Series Episode 6
Crypto-Education Series Episode 7
Crypto-Education Series Episode 8
Crypto-Education Series Episode 9
Crypto-Education Series Episode 10
Crypto-Education Series Episode 11
Crypto-Education Series Episode 12

TURKISH
Ichimoku Kinko Hyo
- Ichimoku, Goichi Hosoda tarafından geliştirilmiş ve 1960'ların sonlarına doğru paylaşılmıştır.
- Gösterge bizlere destek direnç seviyeleri, mevcut fiyat ivmesi ve trendler hakkında bilgi verir.
- 6 bileşenden oluşur.
 winnersedgetrading
6 components of Ichimoku
- Kijun Line
- Tenkan Line
- Chikou Span
- Senkou span A
- Senkou span B
- Kumo-the cloud-. bordered between Senkou Span A and B.
Bileşenlerin Hesaplanması
Tenkan-sen = (9-day high + 9-day low) / 2
Kijun-sen = (26-day high + 26-day low) / 2
Senkou Span A = (Tenkan-sen + Kijun-sen) / 2
Senkou Span B = (52-day high + 52-day low) / 2
Chikou Span = Close plotted 26-days in the past.
Investopedia
algorun
Senkou
- Senkou A ve B destek ve direnç bulut görevi görürler. Fiyatın pozisyonuna göre görevleri değişir.
- Fiyat bulutun üzerindeyse, kanalın üstte kalan çizgisi birinci destek, alt çizgisi ikinci destek görevi görür.
- Fiyat bulutun altında ise, kanalın alt çizgisi birinci direnç, üst çizgisi ikinci direnç görevi görür.
Kijun Sen
-Fiyatın gelecekteki olası hareketi hakkında bilgi sağlar.
- Kijun Sen, Tenkan Sen'e göre daha az fiyat hareketlerinden etkilenir. Bunun sebebi periyot olarak daha uzun bir dilime sahip olmasıdır.
- Tenkan Sen'in Kijun Sen'i yukarı yönde kesmesi, olumlu kesişimdir. Beklenti artış yönündedir.
- Tenkan Sen'in Kijun Sen'i aşağı yönde kesmesi, olumsuz kesişimdir. Beklenti düşüş yönündedir. Bu olaya T-K Stratejisi denir.
Bu kesişimlerin hacim ile olması daha çok tercih edilir. Ve teyit etmek adına başka göstergelerden yararlanmayı unutmamalıyız.
 tradingcermat
Tenkan Sen
- Mevcut marketin trend yönü hakkında bilgi verir.
- Genel olarak, fiyatın olası kazanacağı ivme hakkında bilgi sağlar. Kijun Sen kesişimleri de ayrı olarak yararlanılan özelliklerdendir.
 Indian-forex
Chikou Span
- Diğer bir adıyla Geciken Span
- Alım-satım seviyeleri için geçmiş fiyat trendleri hakkında bilgi verir.
- Bir çok Ichimoku kullanıcısı Chikou Span'i ikinci bir sağlama yapma aracı olarak kullanır.
- Fiyatın üzerinde seyir eden bir Chikou Span olumlu bir yorum getirir.
Sonuç Olarak
- Ichimoku oldukça karmaşık görünen ancak zamanla kullanımı gayet kolay ve yararlı olan bir göstergedir.
- Bir çok kişi tarafından tercih edildiğinden, geçerliliği oldukça yüksektir.
- Her zaman olduğu gibi hatırlatmada fayda var, Ichimoku kullanırken de olası alacağınız pozisyonlar için diğer göstergelerden de yararlanmakta fayda var.
- Özellikle RSI ve Renkli MACD kullanımı yaygındır. Fiyatın hali hazırda ivmesi hakkında sizlere bilgi sağlayacaktır. Göstergelerden yararlanmaya alışmak, teknik analiz konusunda sizi ileriye taşır.