Crypto-Education Series Episode 12 [EN-TR]
Average Directional Index (ADX)
- ADX is another kind of oscillators.
- It also fluctuates between 0-100 levels.
However, contrary to other indicators, ADX does not determine if the trend is uptrend or downtrend.
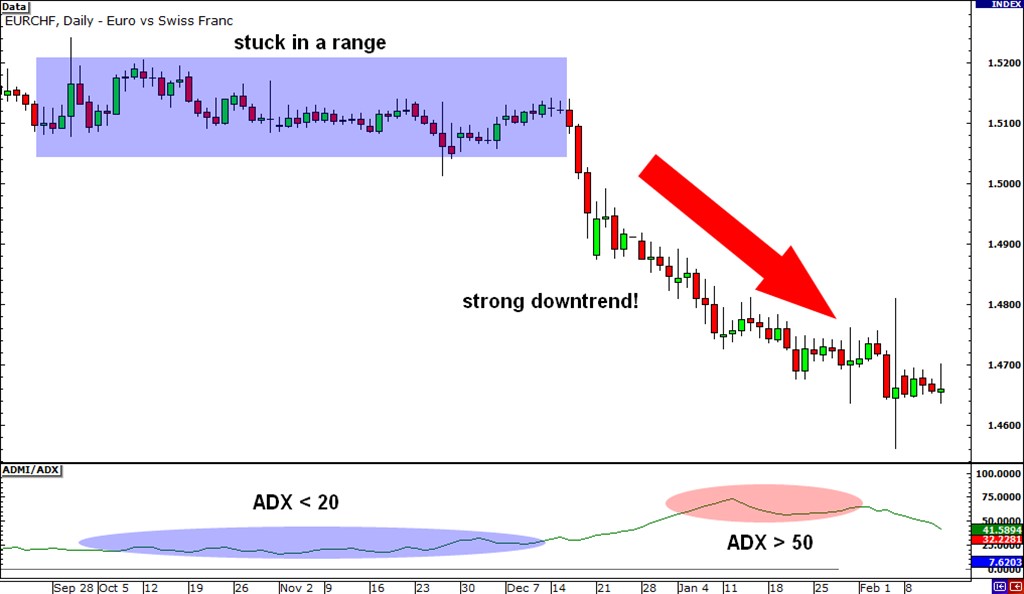
So, ADX is typically preferred to detect whether the market is ranging or about to have a specific trend way.
The average directional index (ADX) is an indicator used in technical analysis as an objective value for the strength of a trend. ADX is non-directional, so it quantifies a trend's strength regardless of whether it is up or down. Investopedia
Forexswingprofit


ADX Levels
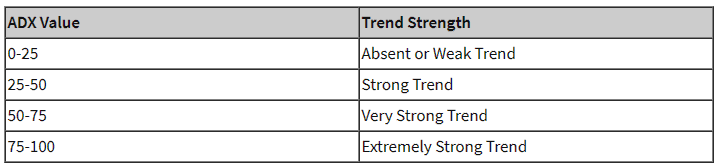
- Generally, when the ADX is below 20, it refers a weak trend and when the indicator is above 50, it signals a strong trend.
On the other hand, for some technicals: - A strong trend is forming when the ADX is over 25; there is no specific trend way below 20.

ADX Strategies
- ADX can be used to confirm whether the price can possibly continue the trend or not.
- While using ADX, combine at least one indicator that assigns whether the price is heading down or up.
As an example of the combination of indicators, ADX- Parabolic SAR.
+DM = previous period high – current period high
-DM = lowest price of previous period – lowest price of current period
ADX is >25, so we are sure the trade will trend and won’t get stuck in a range.
The +D1 crosses above the –D1, which is a long trade signal.
We wait for when the Parabolic SAR indicator shows a bullish signal (dots below candlestick), and we make the long trade entry as shown below.
Investoo

Things to Remember about the ADX
- ADX is a momentum and trend indicator.
- It measures the strength of a trend but it does not give any information about the direction.
- When the indicator crosses above 20, it refers to a strong trend.
- While using ADX, you should combine at least one indicator that determines the price action.

Crypto-Education Series Episode 1
Crypto-Education Series Episode 2
Crypto-Education Series Episode 3
Crypto-Education Series Episode 4
Crypto-Education Series Episode 5
Crypto-Education Series Episode 6
Crypto-Education Series Episode 7
Crypto-Education Series Episode 8
Crypto-Education Series Episode 9
Crypto-Education Series Episode 10
Crypto-Education Series Episode 11

TURKISH
Ortalama Yönsel Endeks (ADX)
- ADX öncü gösterge türlerinden birisidir.
- 0-100 değerleri arasında hareket eder.
Diğer göstergelerden farklı olarak, ADX mevcut trendin yukarı ya da aşağı yönde olduğunu göstermez.
Bu yüzden ADX, marketin herhangi bir trend içinde olup olmadığını belirlemek için tercih edilir. - ADX trendin gücünü ölçen bir göstergedir.
Forexswingprofit
ADX Seviyeleri
- Genel kabul görmüş seviyeler olarak, ADX'in 20 seviyesinin aşağısında seyir etmesi, güçsüz trend gösterirken; 50 seviyesinin üzerinde seyir etmesi güçlü trend anlamı taşır.
Ancak, bazı teknik analizlerince: - ADX'in 25 seviyesinin üzerinde seyiri güçlü trend göstergesi iken, 20 seviyesinin altında oluşu bir trend'in olmadığı anlamına gelmektedir.
 Investopedia
ADX Stratejileri
- ADX fiyatın içinde bulunduğu trendin devamlılığını ölçmek adına başvurulabilir.
- ADX kullanırken, en azından bir adet fiyatın yönünü tayin eden göstergeden yararlanmak gerekir.
Örnekte, Parabolic SAR ile ADX göstergelerinin birlikte kullanımı gösterilmiştir.
Investoo
ADX Hakkında Unutulmaması Gerekenler
- ADX bir ivme ve trend göstergesidir.
- Mevcut trendin gücünü ölçer; trendin yönü hakkında bir bilgi sunmaz.
- Göstergenin 20 seviyesini yukarı kesmesi, güçlü bir trend oluşumu göstergesidir.
- ADX göstergesini kullanırken, en azından bir tane fiyat tahmini yapan göstergeden yararlanmakta fayda var.
Hello! Good article! I'm interested in the them of ICO and crypto-currency, I'll subscribe to your channel. I hope you will also like my content and reviews of the most profitable bounties and ICO, subscribe to me @toni.crypto
There will be a lot of interesting!
Merhaba @agathusia,
Yazınız @trdaily tarafından otomatik olarak seçildi. Ve @trdaily curation trail'i takip eden
@emrebeyler hesabından da oy aldınız.
@trdaily curation trail'e bu adresten katılabilirsiniz.
Yine görüşmek üzere! :)