Crypto-Education Series Episode 11 [EN-TR]
In this episode, we will examine RSI indicator.
- The Basic Use of RSI
- Divergence
- Failure Swings
- RSI Trend Lines
Relative Strength Index -RSI-
- RSI is one of the numerous popular technical indicators developed by Wilder, including the Parabolic SAR, ATR, and ADX.
- The Relative Strength Index is also one of a group of technical indicators known as momentum oscillators.
- It is a useful indicator for determining when prices over overbought or oversold, but traders should use more than one indicator when making decisions.

Onlinetradingconcepts

The Basic Use of RSI
- RSI measures the velocity and degree of directional price moves and represents the data between 0 and 100.
- The indicator is measured using the average gains and losses of an asset over a specified time period.
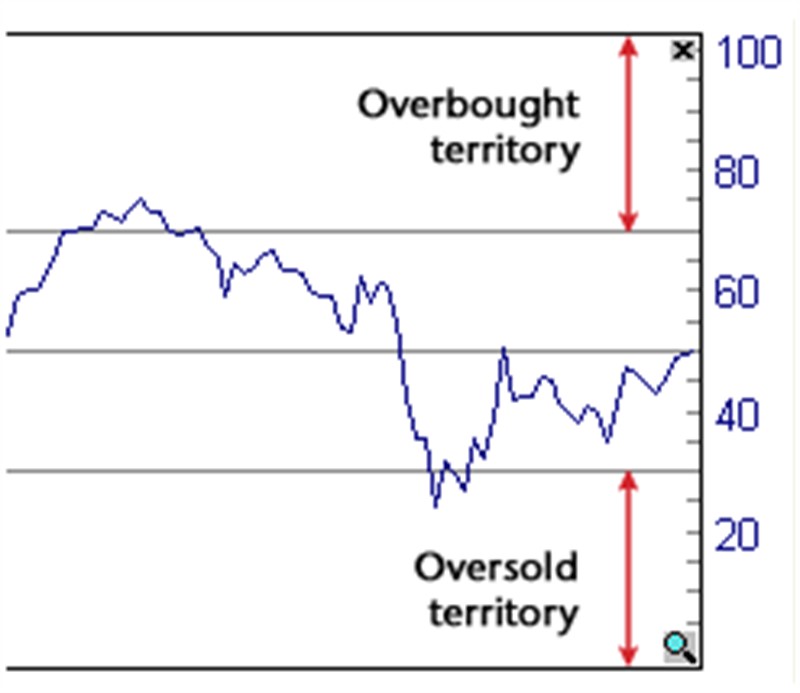
- The most basic RSI application is to identify areas that are potentially overbought or oversold.
- Movements above 70 indicate overbought conditions.
- Conversely, movements under 30 reflect oversold conditions.
The 50 level represents a neutral market. That means there is no specific trend way in the market
Sharescope
Do not forget, the RSI moving above the horizontal 30 reference level is viewed as a bullish indicator ;
the RSI moving below the horizontal 70 reference level is seen to be a bearish indicator.
Divergence
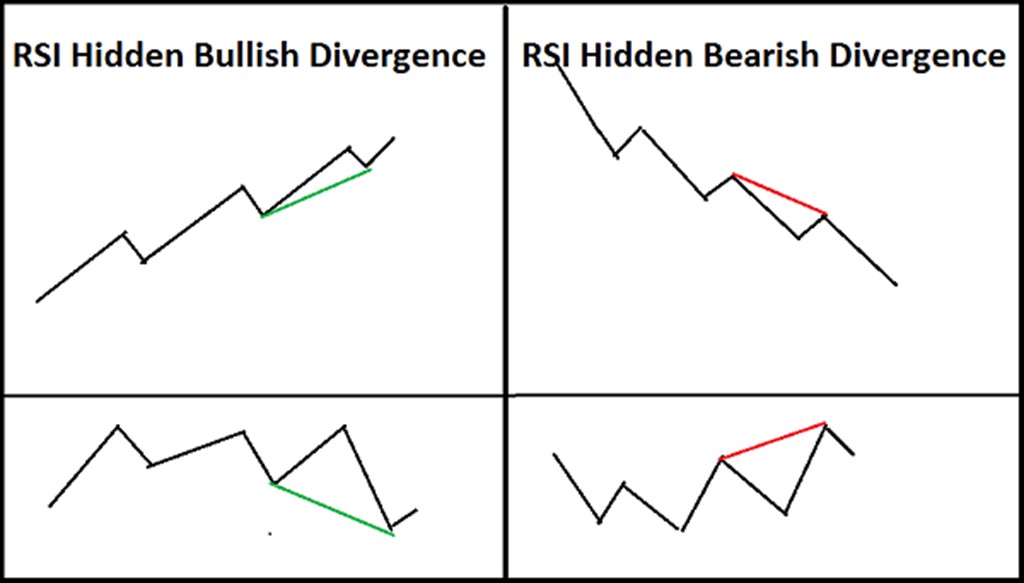
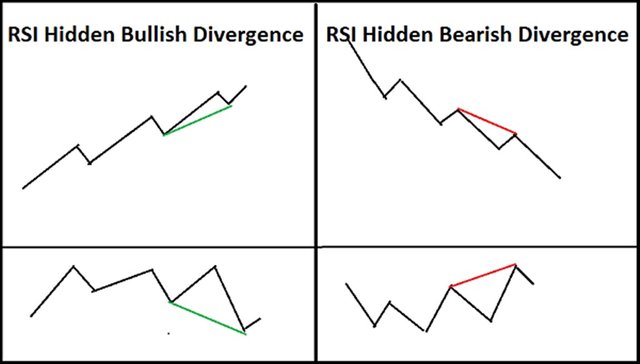
- A bullish divergence forms when the underlying asset makes a lower low whereas RSI makes a higher low.
RSI diverges from the bearish price action in that it indicates a potential upward reversal in price. - A bearish divergence forms when the underlying asset makes a higher high while RSI forms a lower high.
RSI diverges from the bullish price action in that it designates a potential downward reversal in price.
 Indrazinth
Failure Swings
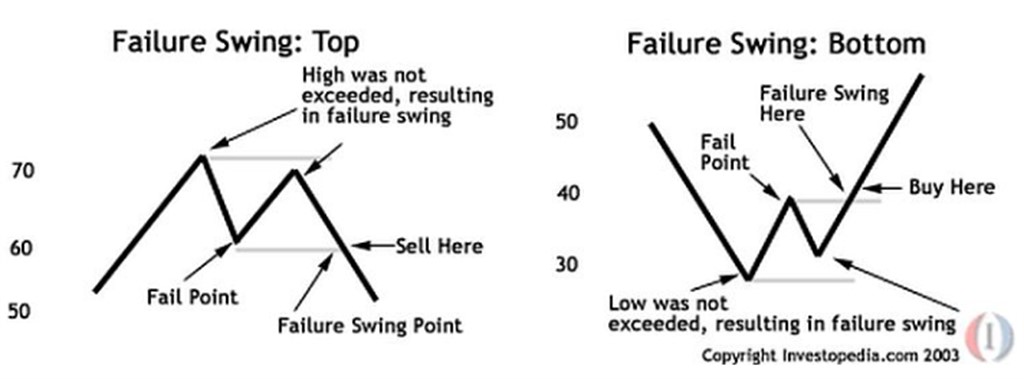
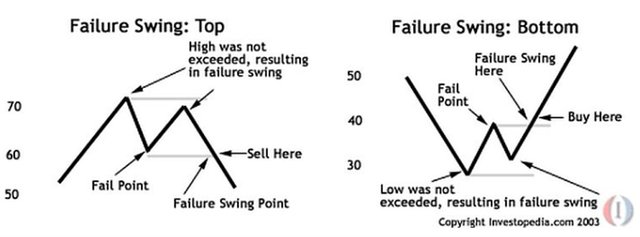
Failure swing can also be used to spot price reversals.
A bullish failure swing forms when RSI moves below 30, climb back above 30 and pulls back again, but holds above the 30 level.
The failure swing is complete when the RSI breaks its recent high; this breakout is interpreted as a bullish signal.A bearish failure swing forms when RSI moves above 70, trails back below 70 and rises again, but holds below 70.
The failure swing is complete when RSI breaks its recent low; this breakout is defined as a bearish signal.
Investopedia
RSI Trend Line Breaks
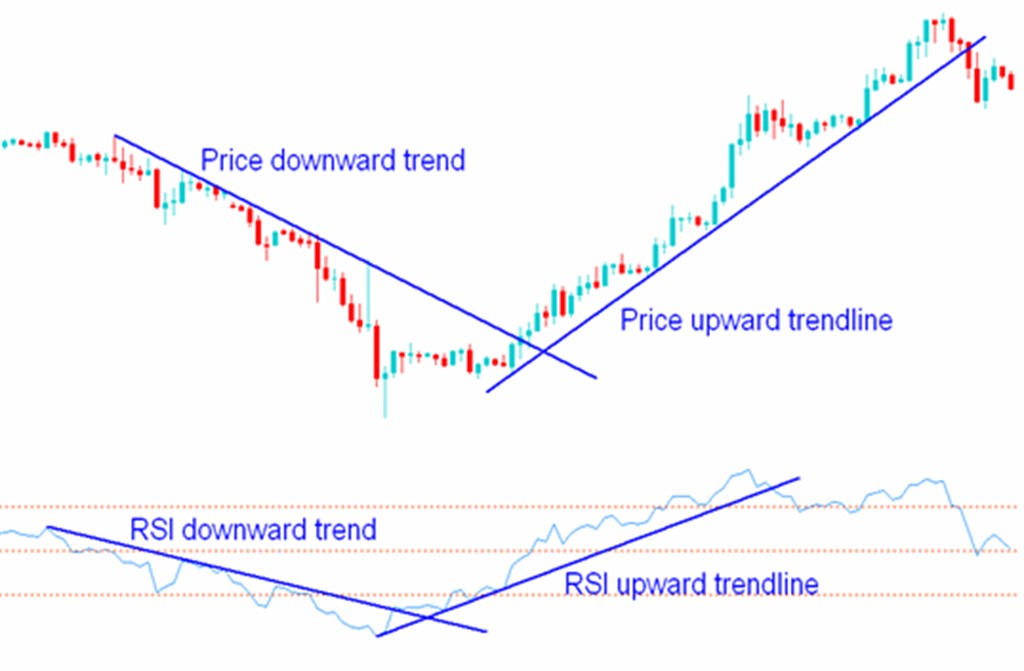
Trendlines can be used on the RSI oscillator itself,in the same way as on price charts.
To draw a trend line on the oscillator connect higher lows in an uptrend or lower highs in a downtrend.
Breakouts above or below these trendlines can serve to designate a potential reversal in price.
Source
Crypto-Education Series Episode 1
Crypto-Education Series Episode 2
Crypto-Education Series Episode 3
Crypto-Education Series Episode 4
Crypto-Education Series Episode 5
Crypto-Education Series Episode 6
Crypto-Education Series Episode 7
Crypto-Education Series Episode 8
Crypto-Education Series Episode 9
Crypto-Education Series Episode 10

TURKISH
Bu bölümde Göreceli Güç Endeksi(RSI) Göstergesini inceleyeceğiz.
- RSI göstergesinin temel kullanımı
- Uyuşmazlıklar
- Yalancı Sarkmalar
- RSI Trend Çizgileri başlıklarını inceleyeceğiz.
Göreceli Güç Endeksi
RSI teknik bir gösterge aracıdır. İvme göstergesi olarak kullanılır.
Genel olarak aşırı alım ve aşırı satım durumlarında yararlanılır. Ancak tek göstergeye bağlı kalarak alım-satım işlemleri yapmamak gerektiğini tekrardan hatırlayalım.
Onlinetradingconcepts
RSI Göstergesinin Temel Kullanımı
- Göstergemiz, fiyat hareketlerinin hız ve yönelim hareketlerini 0 ile 100 arası değerlerde bizlere gösterir.
- RSI belirli bir zaman aralığında, fiyat kazan ve kayıp değerlerinin ortalamasının alınması ile ölçülür.
- En temel kullanılan özelliği, aşırı alım ve aşırı satım bölgelerinin belirlenmesidir.
- 70 değeri üzeri aşırı alımı ; 30 değer altı aşırı satımı temsil eder.
50 nötr market seviyesidir. Bu seviyede marketimizin yön tayin etmediğini anlarız.

Sharescope
- Unutmamalıyız ki, RSI göstergesinin 30 seviyesini yukarı yönde kesişi olumlu kesişim ; 70 seviyesini aşağı yönde kesişi olumsuz kesişim sonuçları doğurur.
Fiyat / Gösterge Uyuşmazlığı
RSI göstergesin fiyat ile benzer hareketler sergiler. Sergilemediği durumlar ise uyuşmazlıklara neden olabilir. Pozisyon alırken uyuşmazlık durumunu gözden geçirmekte her zaman fayda vardır.
- Fiyat düşük dipler oluştururken RSI yükselen dipler oluşturuyorsa bu olumlu uyuşmazlıktır.(Bullish Divergence)
- Fiyat yükselen tepeler oluştururken RSI alçalan tepeler oluşturuyorsa bu da olumsuz uyuşmazlıktır.(Bearish Divergence)
Yalancı Sarkmalar
Yalancı sarkmalar da geri dönüş noktalarının belirlenmesinde yararlanılabilir. Anlatımı biraz karışık gelebilir ancak görsel ile anlaşılması daha kolay olacaktır.
- RSI değerinin 30'un altına düştüğü, ardından geri 30'un üstüne çıkıp tekrar salınım yaptığı, ancak sonunda 30 seviyesinin üzerinde tutunduğu durumlar olumlu salınım olarak görülebilir. Beklenti artış yönündedir.
Olumlu yalancı sarkma hareketi RSI göstergesi önceki yüksek seviyesinin kırması ile gerçekleşir. - RSI değerinin 70'in üzerine çıkıp, 70 seviyesinden düşüp tekrar tırmandığı, son olarak 70 seviyesinin altında seyir ettiği durumlar olumsuz salınım hareketidir. Beklenti düşüş yönünde olur.
Olumsuz yalancı sarkma hareketi RSI göstergesinin önceki düşük seviyesini kırması ile gerçekleşir.
Investopedia
RSI Trend Çizgisi
Fiyat grafiklerinde trend çizgileri çizildiği gibi, RSI göstergesinde de trend yönü üzerine çizim uygulanabilir.
- Trend çizgisi çizmek için, Yükselen trend için yükselen dipler, Alçalan trend için ise alçalan tepeler üzerinden trend çizgisi çizilebilir.
- Bu çizgi üzerinde yaşanacak bir kırma hareketi, trend değişiminin habercisi olabilir.
Source