ECCO - Analysis of reactor and fuel components showing unexpected elements
We analysed the part processed fuel and foil that was supplied to us by Suhas Ralkar designed for use in the ECCO "free energy" reactor.
When analysing the reactor structure Ni foil and part processed fuel with EDX at Masaryk University, amongst other elements, in the foil we found unexpected Au, Ag, Pd and in the powder, Nb, Sn, Zr and a large quantity of Pb.
Foil production inputs
SS304 anode and cathode, de-ionised water (will absorb CO2 from air), nickel sulphate, electric discharge, 200V DC pluses at 300kHz and 300kHz and surface wave on SS304 substrate
Part-processed fuel inputs
SS304 container, de-ionised water (will absorb CO2 from air), Ti (80-100um), Ni (80-100um), C (5um), 4.5kW of 19.46kHz sound
MALDI
To understand further what was going on, we employed Matrix Assisted Laser Desorption / Ionization Time Of Flight Mass Spectrometry (MALDI TOF MS} which is, above masses around 90, able to look at, isotopes, dimers and molecules.
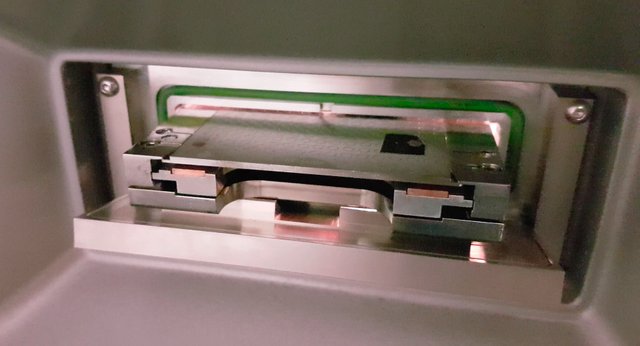
In the video below, we discuss a little of what is going on as a sample area with ECCO part-processed fuel on, is being scanned and analysed by the equipment.
In the video below, the difference between positive and negative mode analysis. How to attach powders and which laser energies will reveal what masses.
MALDI data and analysis tool
Here is the data and we used the free mMass application to analyse it.
Deciphering dimers of NiNi, NiCu, NiZn etc is a complicated business, as is looking for evidence of chlorides, sulphates, hydroxides and oxides. We would really appreciate anyone that can take a look at the data and give insight as to what may be going on.
The software that came with the Shimadzu MALDI unit had the ability to do weighted adducts as you can see in this shot.
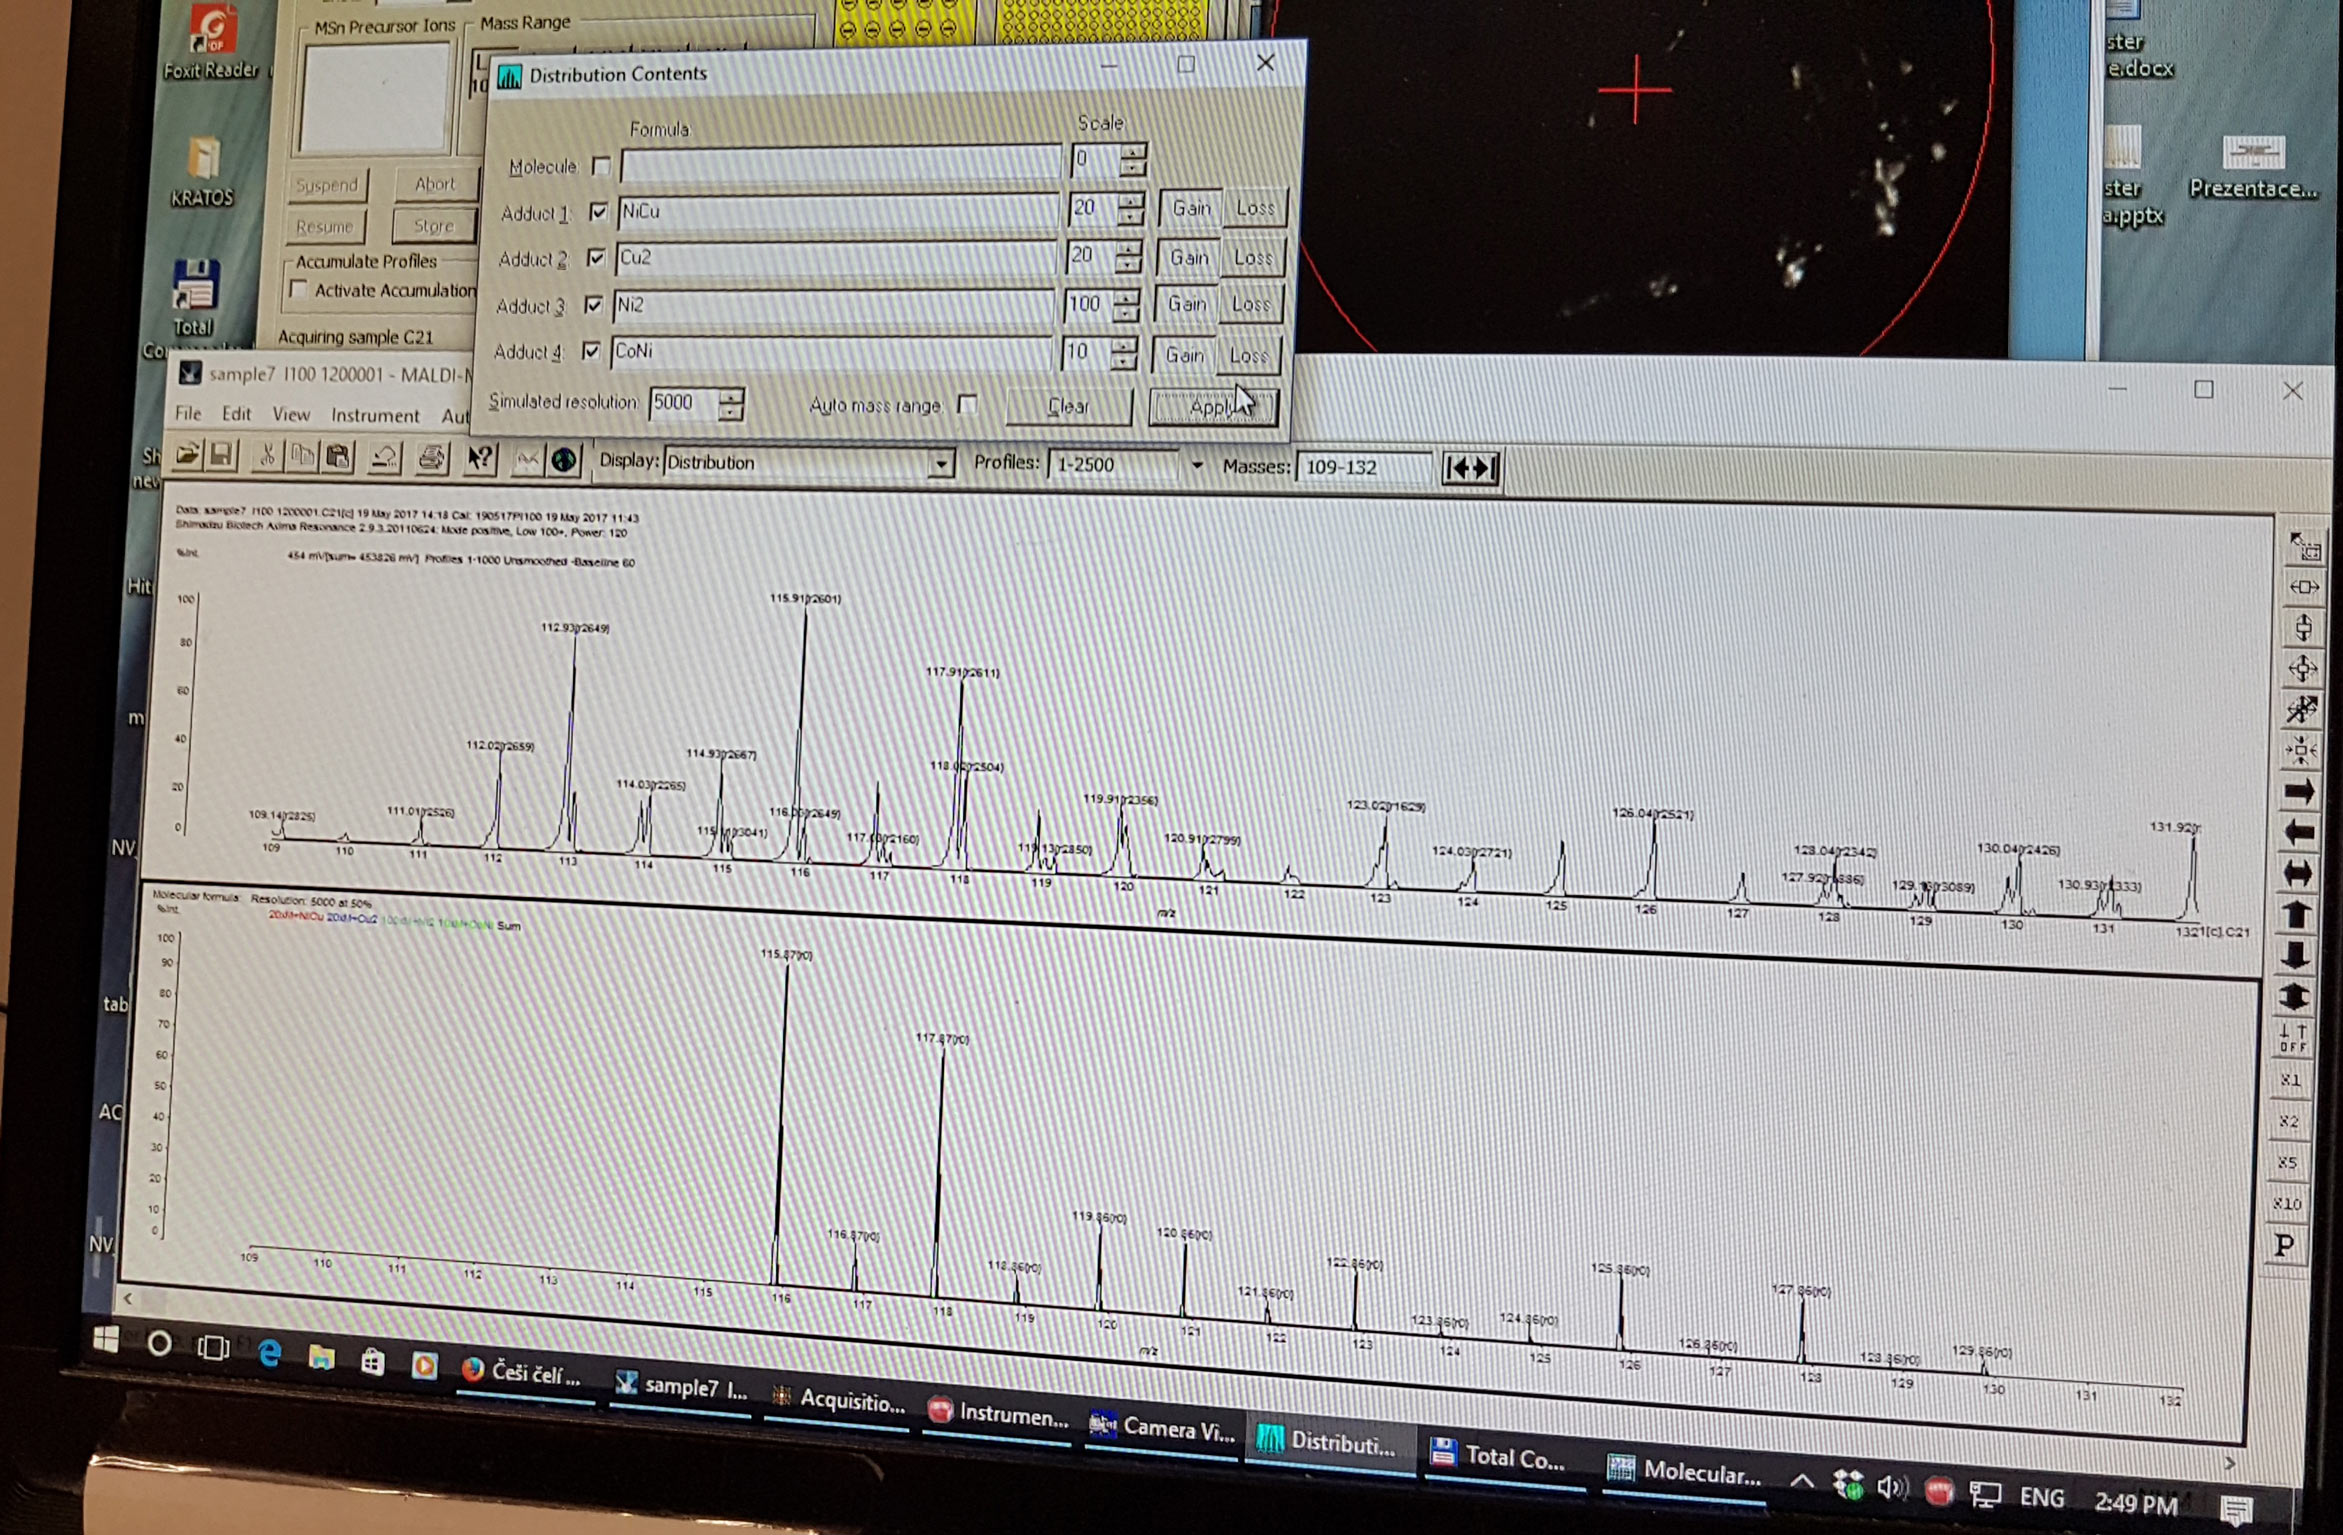
In the video below, we use the capability of the Shimadzu software to simulate dimers, say NiNi, NiCu etc. with weighting ratios to create an artificial output based on the naturally occurring ratios of the element isotopes. We attempt to goal seek the observed data by adjusting this artificial output.
Some observations from the MALDI part processed fuel powder data
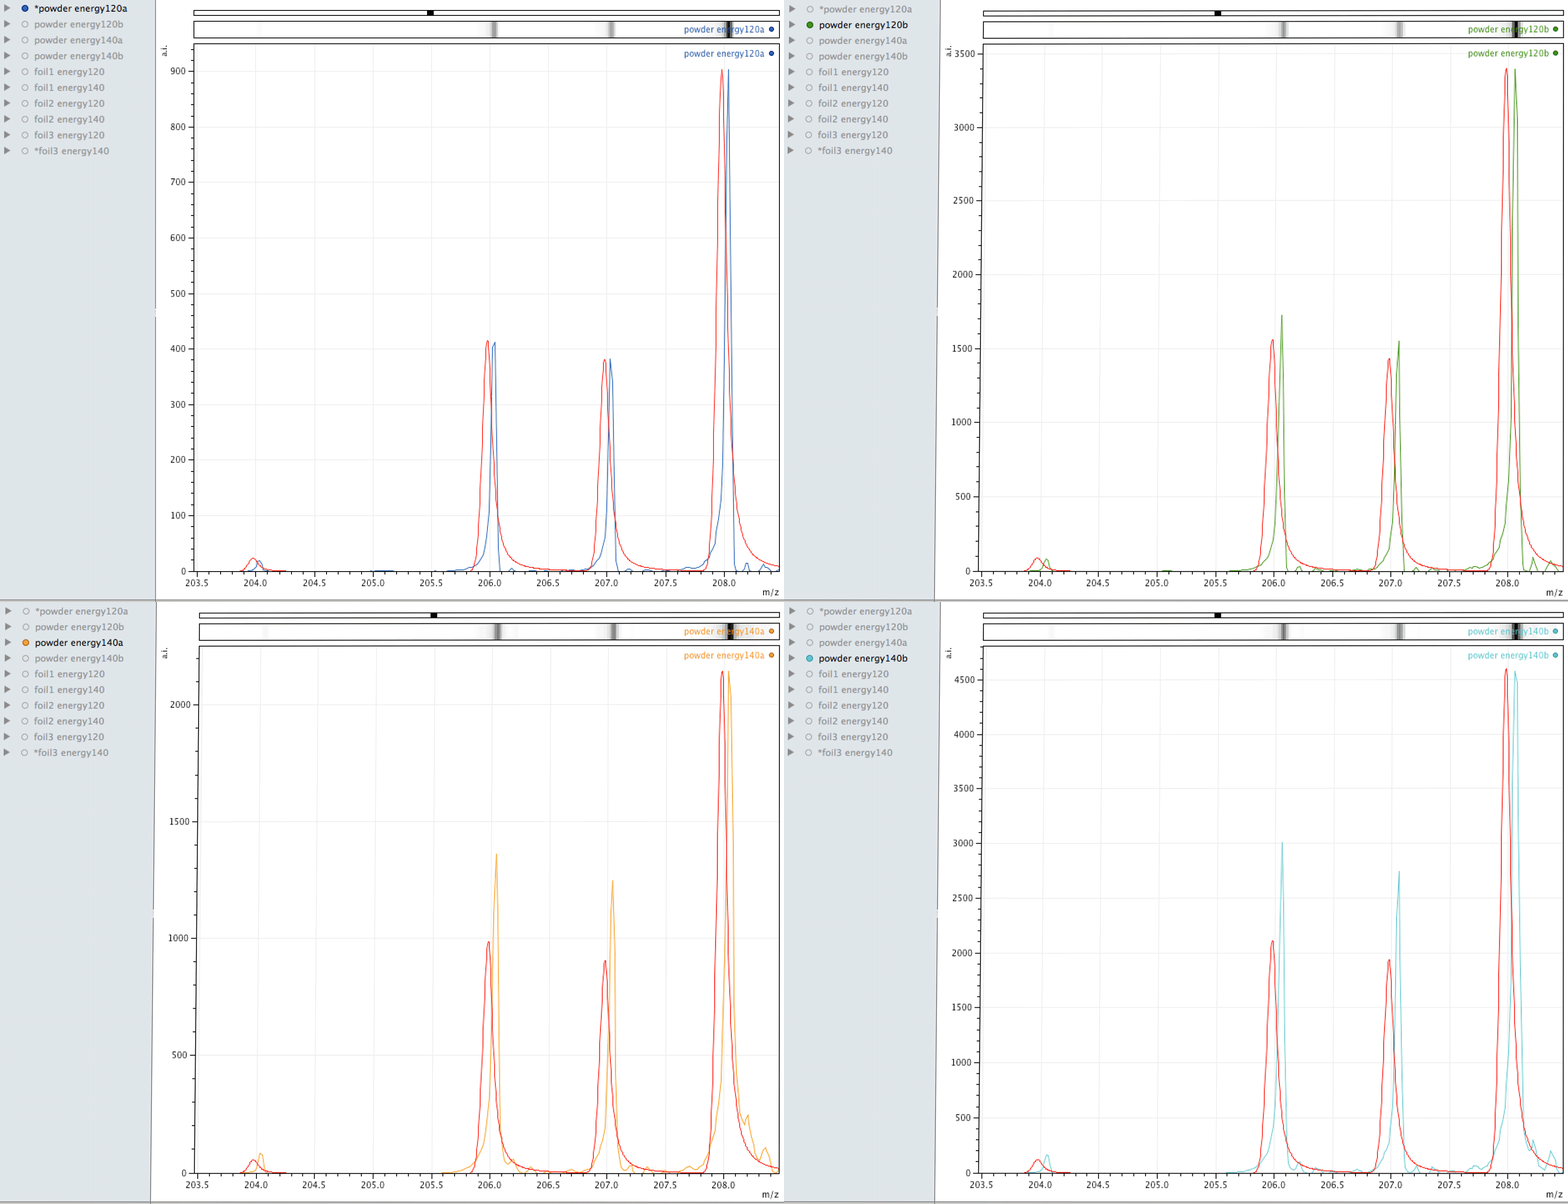
Comparison of observed lead to its normal isotopic ratio across 4 sample sets
In the above sequence, the red lines are representing the natural isotopic distribution normalised to the most significant isotope. In this sequence, we can see that only one of the sample sets, the one with the lowest number of samples and lower laser energy, shows natural isotopic ratio. How can this be explained?
Where did the silver come from?
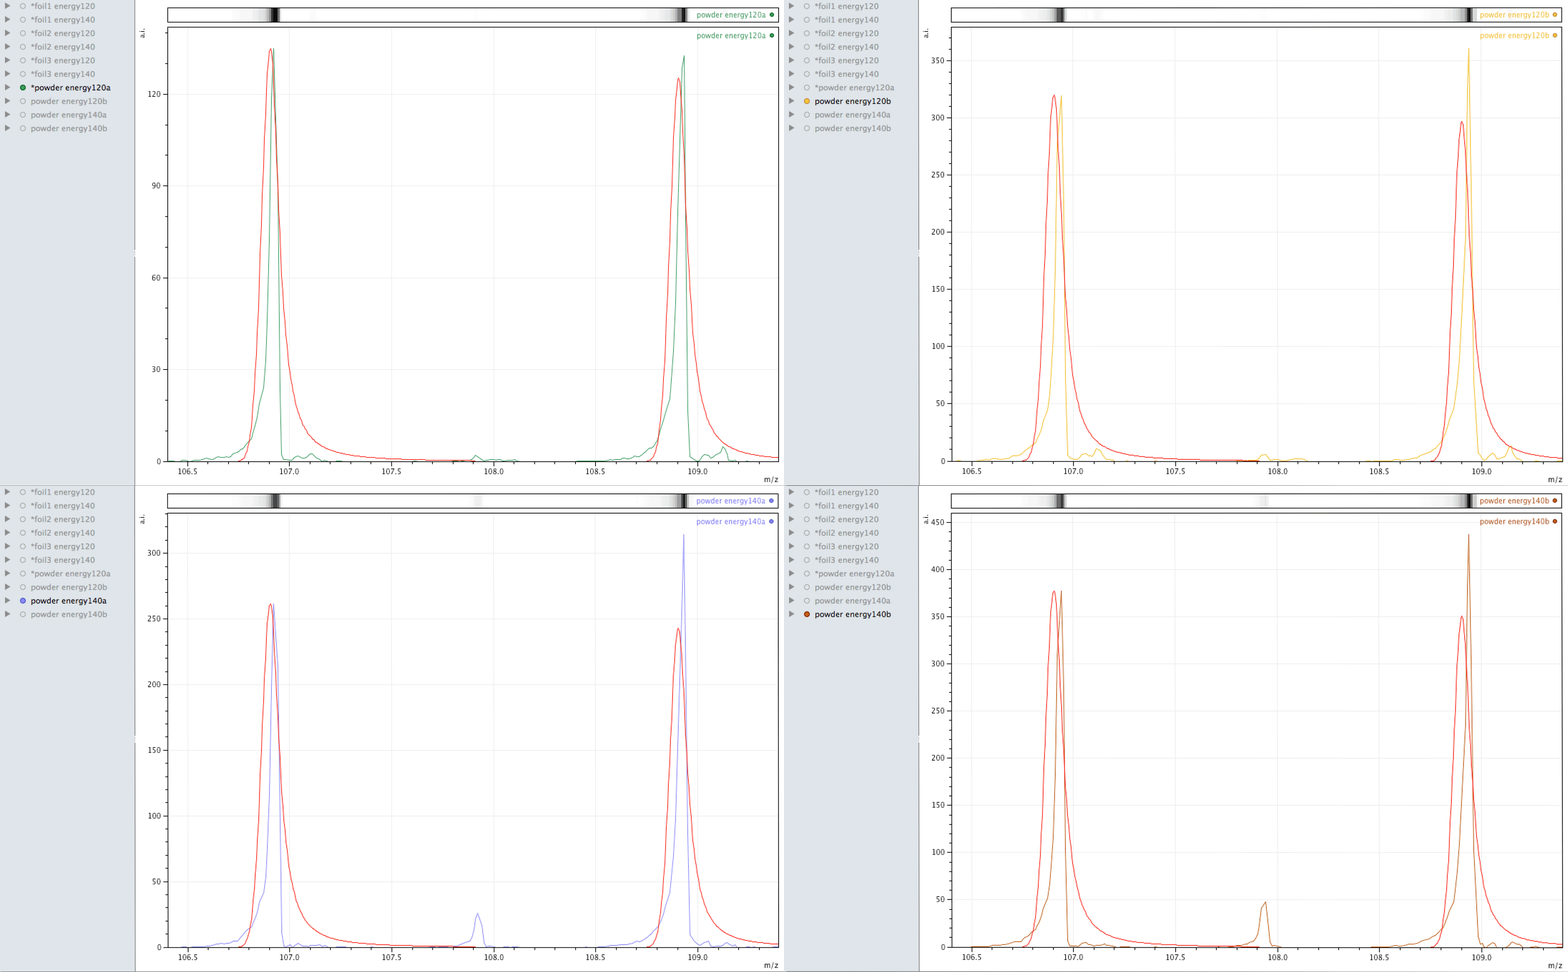
What you are looking at in the animated Gif above, is 4 different samples of the same powder exposed to two different laser energies between them and a varying number of individual sampling points.
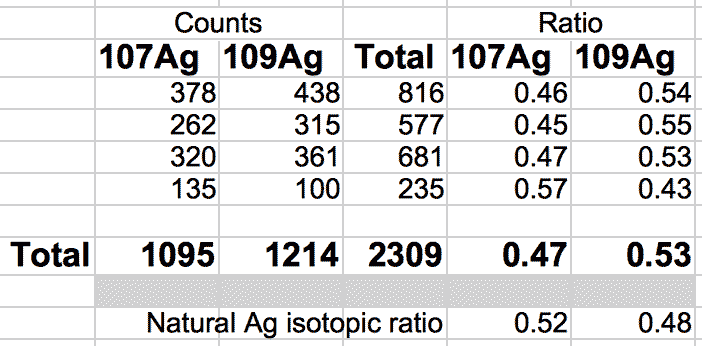
The natural ratio of Ag according to Wikipedia to 0dp is 52%:48% 107Ag:109Ag, adding all sample sets together we get an inversion in the ratios in the ECCO part-processed fuel - 47%:53% 107Ag:109Ag.
If the silver is not there to begin with, where did it come from? If the silver is contamination, why is the isotopic ratio not natural?
Some observations from the MALDI foil data
Holmium on the foil?
Unlike EDX, where you can look around the sample easily and see areas of interest that may be rich in an element, with MALDI, one samples across the surface, so it is more representative of the average constituents. When looking at the foil, an
apparently mono-isotopic signal stood out - that of Holmium. What else could it be?
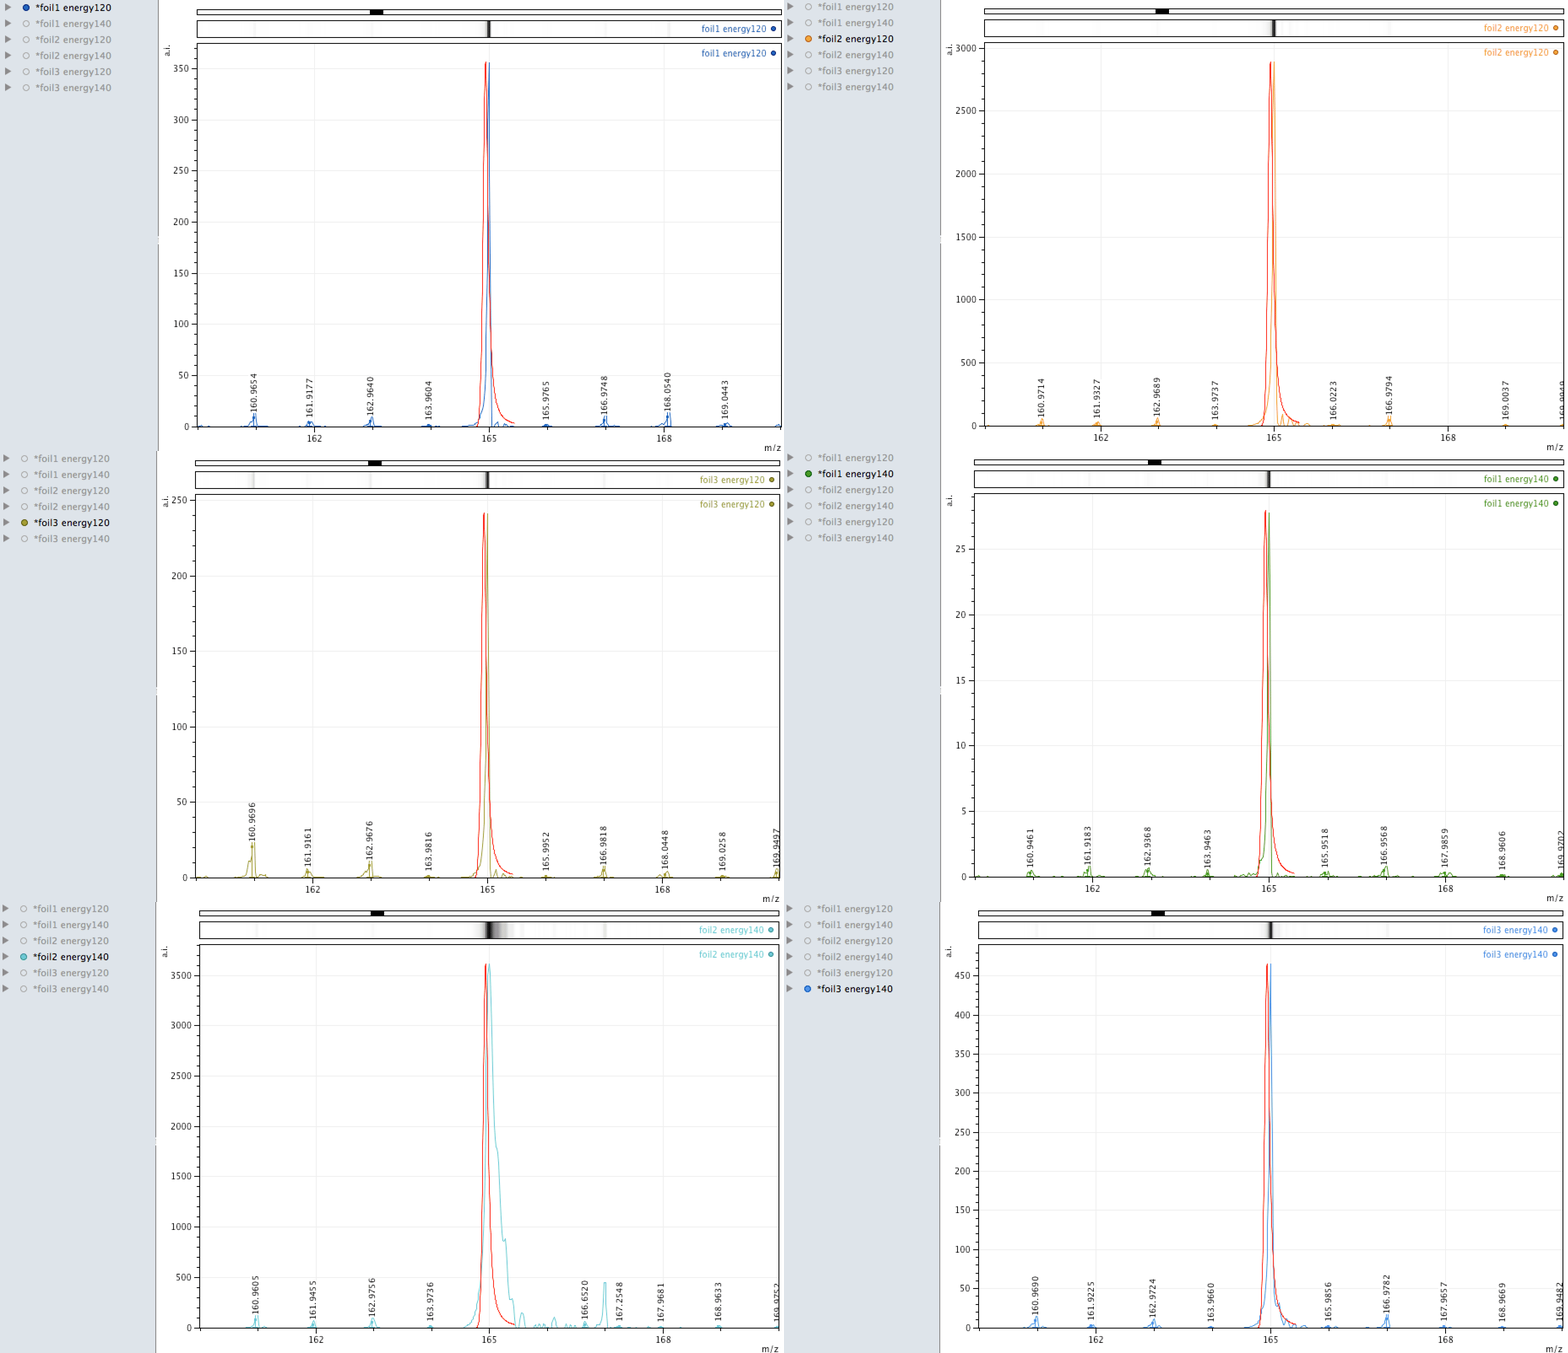
Or could it be Manganese (Mn3)?
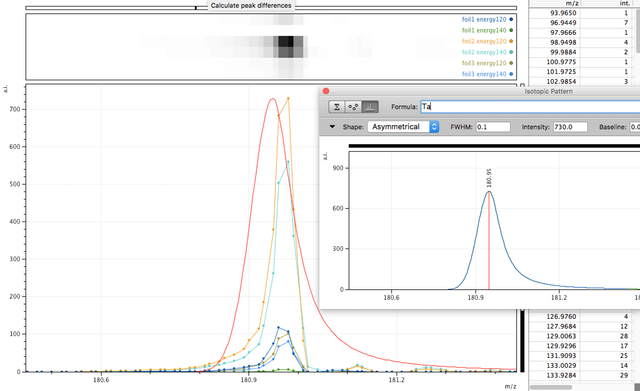
Tantalum too?
Mono-isotopic elements are easier to find in the data especially where there are no other interfering elements. Also - a clear peak with little either side at higher masses is more easy to define, since compounds or molecules may have isotopes resulting in a spread distribution, say for instance molecules containing C, O, H or atomic clusters containing Ni, due to different stable isotopes this would lead to a spread around the most likely combination. For this Tantalum peak to be something else, say a cluster of other atoms, that something else would have to be mono-isotopic also.
Gold
Gold was found in high concentrations in localised areas on the foil during EDX analysis, its single isotope was also observed in the MALDI analysis also - however, MALDI, as said above is more hit and miss so when spanning an area and firing the laser results can vary and the quantity observed is low.
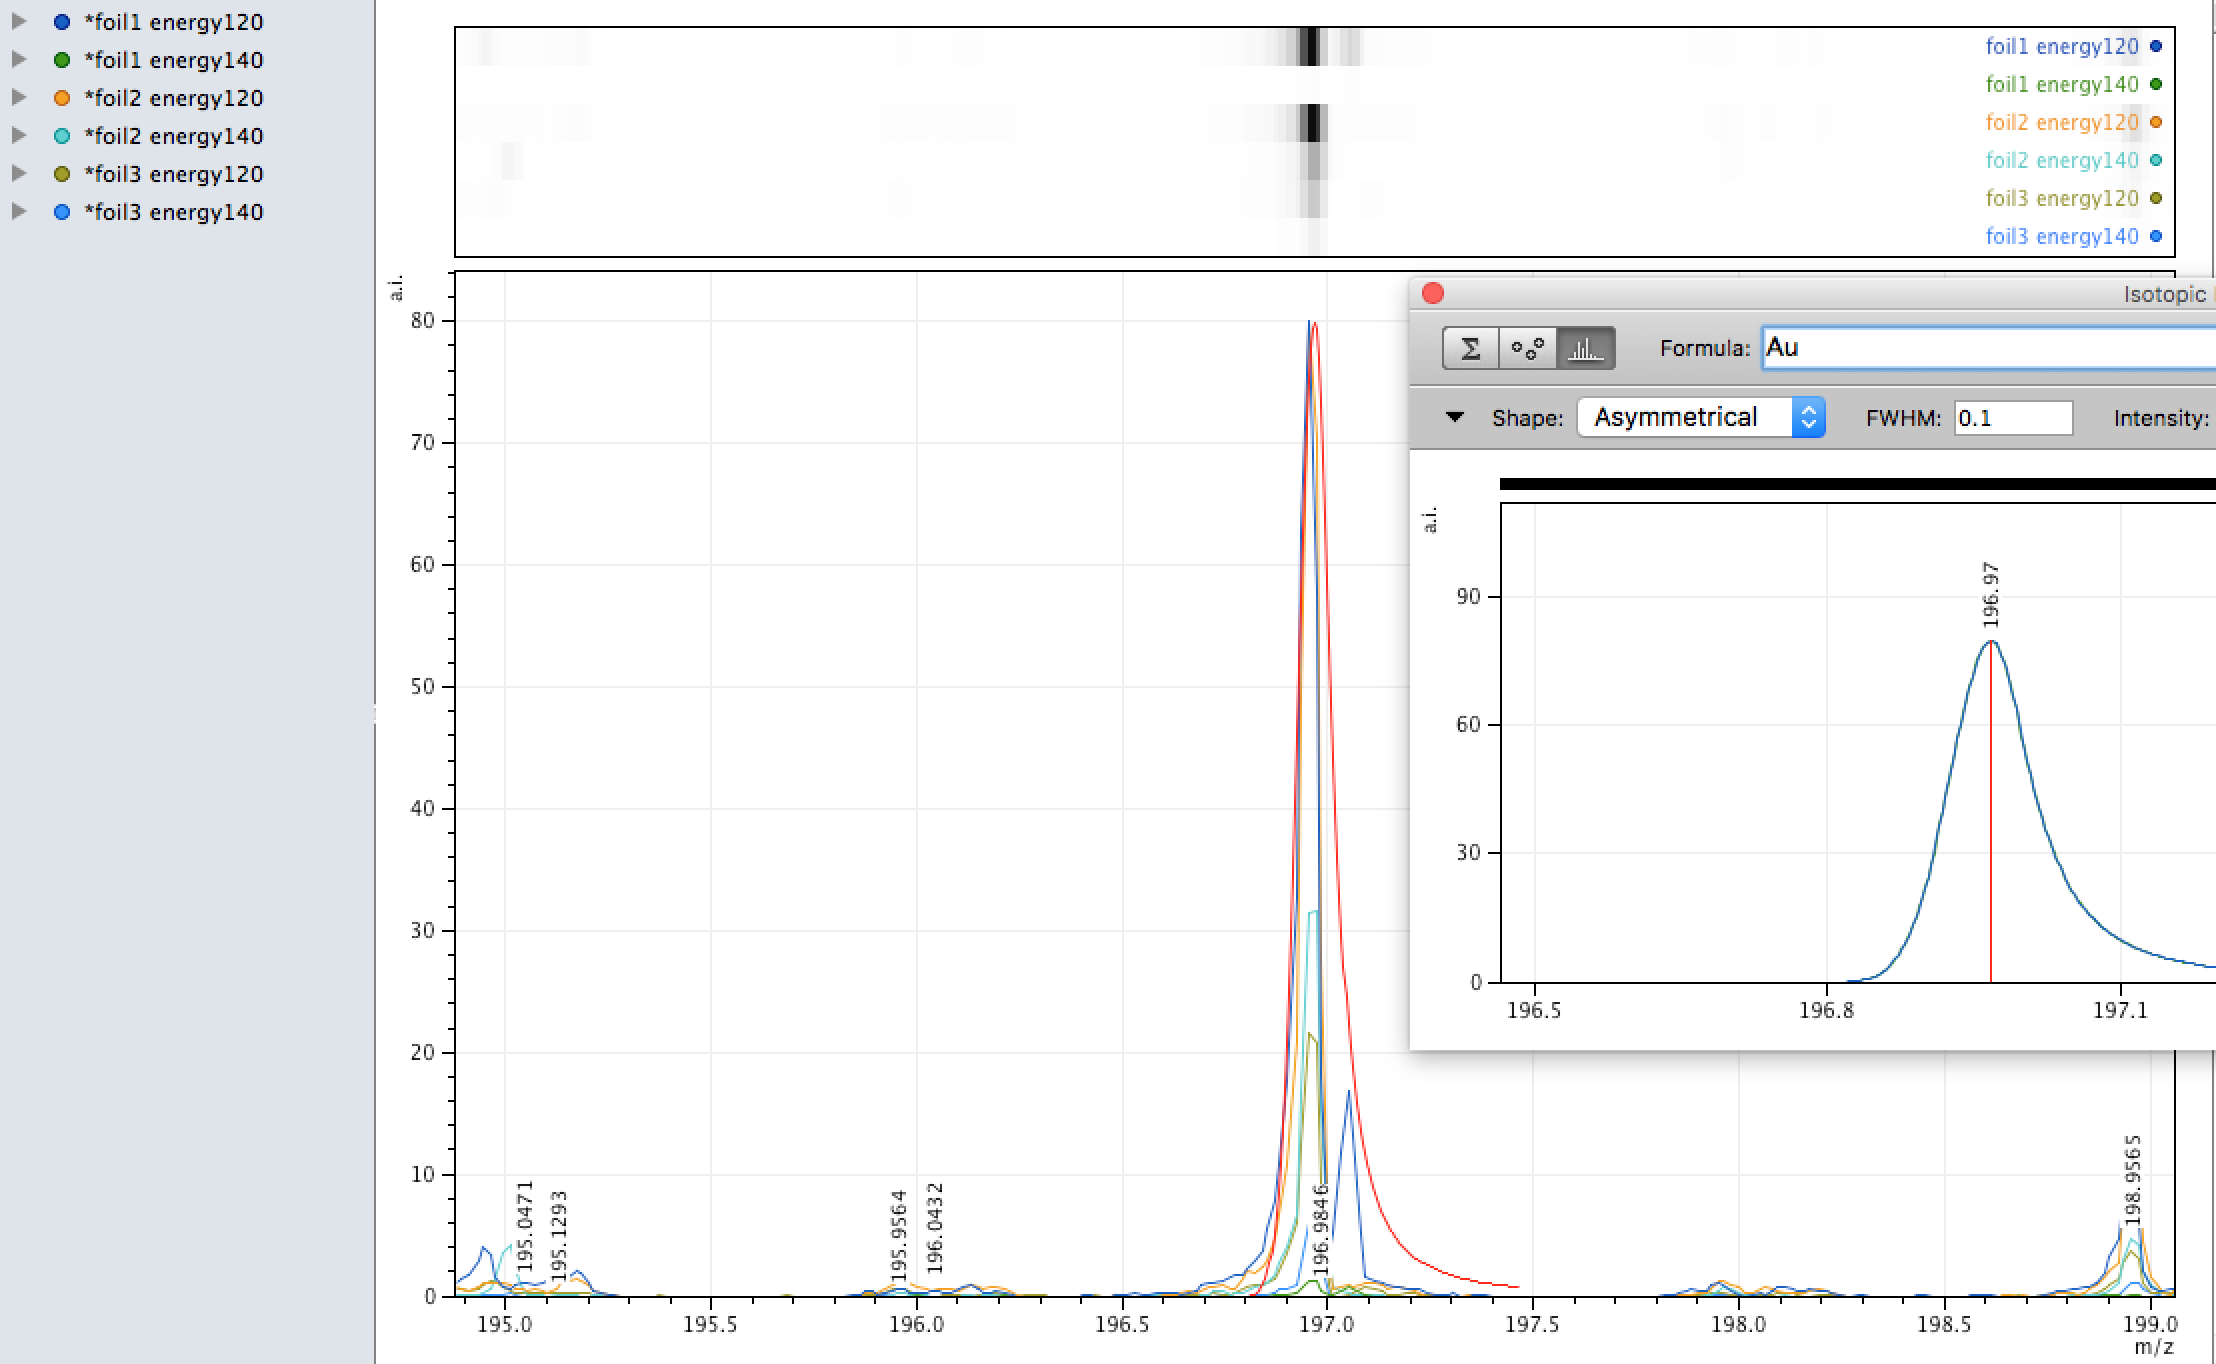
What do you think?
Please grab the data and the analysis tool and see what you think it is pointing to. Is it all impurities? Are there other explanations for the isotopic variance? Can molecules, organic or not, account for the masses found? Please cross reference with the EDX data.
Thankyou to Nicolas Chauvin of LENR Cars for funding the data aquisition


Q: Is the MALDI data supporting the EDX results?
A: Certainly there is lead in the powder as was shown in the EDX - it is easy to find since so much of it is lead. There is also Gold on the foil, however, because there are so many isotopes of Pd, it is difficult to decipher.
It comes down to the nature of the differing analysis techniques / way the process works. In SEM/EDX, you can literally see by colour or structure interesting features and specifically analyse them - Au, Ag and Pd stand out against Ni, or say lead as it is just squashed, it looks soft. There is a new video above where you can see how the Shimadzu MALDI unit just scans an area to determine the isotopic nature of the material.
Q: are adducts combinations of atoms such as atomic pairs?
A: Yes, and you can see the combinations of isotopic weights (based on natural isotopic ratio data) in the data. A new video has been added above to help explain this
Hi the data linked only seems to be a single run ? Is there more.
Do you have any information about the sample prep ?
Any acid washes or anything ?
The data should have multiple runs at various energies. In terms of positive, there was only 1 at each energy.
I think there was 8 runs for the powder (6 negative, 2 positive) and 6 for the foil, (4 negative, 2 positive)
Let me know if you see different.
The foil was just stuck down bare.
The powder in Acetonitril (see photo above)
The foil and powder was also tested with SEM/EDX (data above)
We hope to run ICPMS on it also.
Suhas Ralkar has added that the fuel powder analysed here was prepared with an additional 2% of LiOH, so there was a small quantity of Lithium present in the mixture.