BITCOIN –Short-Term Update, Bias, & Key Statement for 6-4-2018
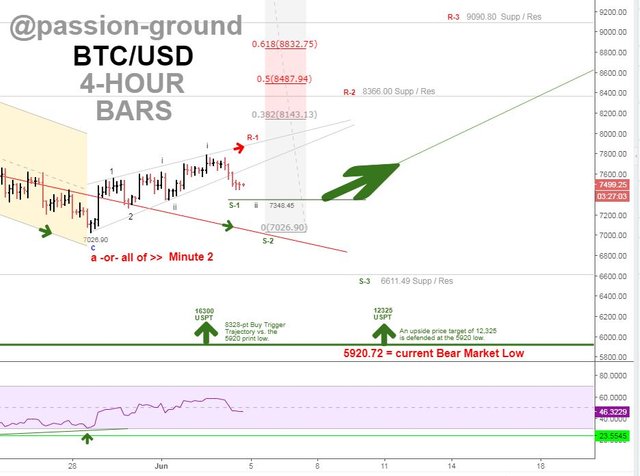
BTC must hold 7348.45 or it’s heading back down.

…Key Statement:
The rally off the nearest pivot low has been weak. Fret not, there is a silver lining of a bullish persuasion; however, that lining will go dark upon trade beneath 7348.25. See the video for details.

| Short-Term | Bias | Target | Sup-1 | Sup-2 | Res-1 | Res-2 |
|---|---|---|---|---|---|---|
| 4-Hour Chart | Bearish | 6,830 | 7,348.45 | 7026.90 | 7,395 | 8,366 |

| Medium-Term | Bias | Sup-1 | Sup-2 | Res-1 | Res-2 |
|---|---|---|---|---|---|
| Daily Chart | Bearish | 6,427 | 5,920 | 8,120 | 9,173 |

| Long-Term | Position Bias | Date | Price |
|---|---|---|---|
| Weekly Chart | Bearish | 5-14-2018 | 8696.54 |

| SECULAR | Bias | Low 2018 | Target 2018 |
|---|---|---|---|
| Monthly Chart | Bearish | 5,920? | 12,235 min / 37,419 max |

…You Can’t Miss with Swiss-Chris!
Otherwise known as @famunger, Chris puts together a daily recap of all the top technical analysts across STEEMIT, and beyond. He does so in order to provide the community at large with the best possible forecasting guidance relative to the price of BITCOIN, and by default, the balance of the crypto-world at large.
In checking out @famunger’s daily recap, you simply can’t miss! His collective assessments of all the select analysts are akin to getting the very best snapshot of what the near and long-term future is likely to hold for those with a vested interest in BITCOIN and the multitude of coins, tokens, and alternative currencies that BITCOIN clearly paves the way for.

…BTC Update
Right Click and open in new tab to view full size image.


…Video Update
Select HD and “Full-Screen” for the utmost clarity in viewing this video update.

I trust that the preceding analysis and proof of work herein are generally objective, explicitly actionable and informative, and of relative and meaningful value for all those who perceive such analysis as a backstop to their individual ends.
Until next time,
Peace, Love, and Justice for All

In closing, I’d like to impart the following shout-outs to all of my fellow analysts here on the STEEMIT platform and beyond:
They are in no particular order:
To Tone Vays for his incredible energy in producing a wide variety of valuable content along with his proprietary version of Tom DeMark’s sequential indicator.
To @ew-and-patterns for inspiring me to get back into TA, and for his level of professionalism and balance in sharing his views with the community.
To @lordoftruth for his always awesome graphics and his undeniable commitment to report on his latest sentiments with regard to the price of BTC.
To @philakonesteemit for his honesty and in-depth look at market structure via order-books, short-term trading dynamics, EWT, and the like.
To @haejin, despite the seemingly never-ending flag-wars associated with his account, he nonetheless imparts a measured assessment of BTC market dynamics relative to EWT theory that is worthy of consideration – in spite of anything else that might be going on with regard to the ongoing controversy surrounding “reward pool” dynamics.

DISCLAIMER: This post and all of the analysis contained herein serves general information purposes only. I am not a registered financial adviser. The material in this post does not constitute any trading or investment advice whatsoever. The trend-following strategies explained herein are for example only, and should not be construed as trading or investment advice in any way. The same thing goes for anyone subscribing to the Long-Term Trend Monitor. The subscription simply shares with subscribers what several automated trend-following systems are doing, and that’s all. The bullish and bearish alerts provided therein are for information purposes only, and they are not to be construed as advice to buy or sell. At the time of this writing, the author holds a small position in BITCOIN and several other crypto-currencies. Please conduct your own due diligence, and seek counsel from an accredited financial advisor before making any trading or investment decisions. Should you decide to mirror or copy any investment or trading examples from this or any other related source, the decision to do so is entirely your own - as are the inherent risks involved in doing so. I am not responsible for any of your losses. By reading this post, you acknowledge and accept to never hold me accountable for any financial losses. Thank you.


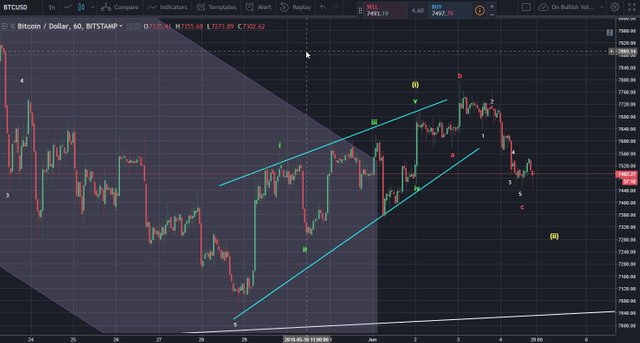
What do you think about the idea that we have seen a leading diagonal wave up and we possibly completed an extended flat?


Example
Fair possibility, Kevin. I might consider modifying your leading diagonal count to reflect your (i) wave at the wick high (vs the expanded "b"-wave) - and the subsequent move down as the "a" of "c" of (ii) or "all-of" the (ii) wave. As always, I recommend framing all such possibilities within the larger framework of one's big picture thesis. Thanks for the chart!
Yes. i realized today that not all exchanges show that wick that labeled B higher than what I labeled (i).
We came awfully close to $7,348 that you called as the last stand.
Indeed we did! Let's see if 7348 can hold and a sustainable meaningful rally of merit is able to manifest from there. ... Unless "candlestick" analysis is being applied, I prefer to use standard bar charts... That's just me...
Hey my friend, any chance you might consider stepping up the frequency on your updates to daily or every couple of days, or is that just too much time commitment? Just asking hopefully...
I'd be happy to @cannonball6, however, to do so without the effect of "watching grass grow" - I'd have to move toward observing shorter timeframes i.e. hourly or 30-minute charts. Not a lot happens on a day-to-day basis with the 4-hour chart. I could, however, add more updates in discussing the bigger picture. Thanks for asking, I'll give that a try and hope that I don't sound like a broken record! :-)
How much do you think chart analysis can anticipate the price movement?
Ive always held the position that in a small market like Crypto (Market cap of the whole Crypto market being almost equal to the market cap of the Apple stock)
economic analysis without taking into account external effects, legislation, promotion, mainstream perception, etc.... cant show us much.
In the stock market that is huge and much more stable, you can find constants that you could use to create a model.
I just dont seem to see that here.
The only way i think this kind of analysis could tell us something is if the major investors started using elliot waves to determine their future investments. That way you could basically guess how the price would turn by knowing the investor primary tool they use.
Maybe im wrong. haha