You are viewing a single comment's thread from:
RE: BITCOIN –Short-Term Update, Bias, & Key Statement for 6-4-2018
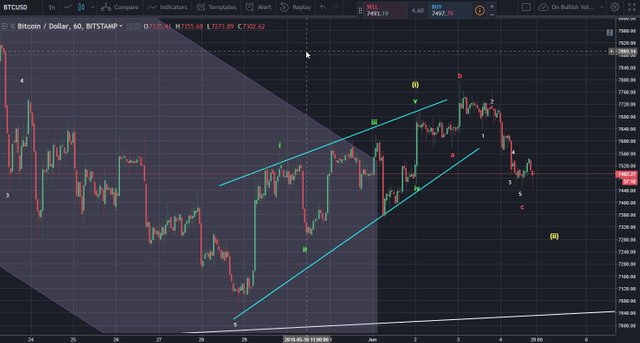
What do you think about the idea that we have seen a leading diagonal wave up and we possibly completed an extended flat?
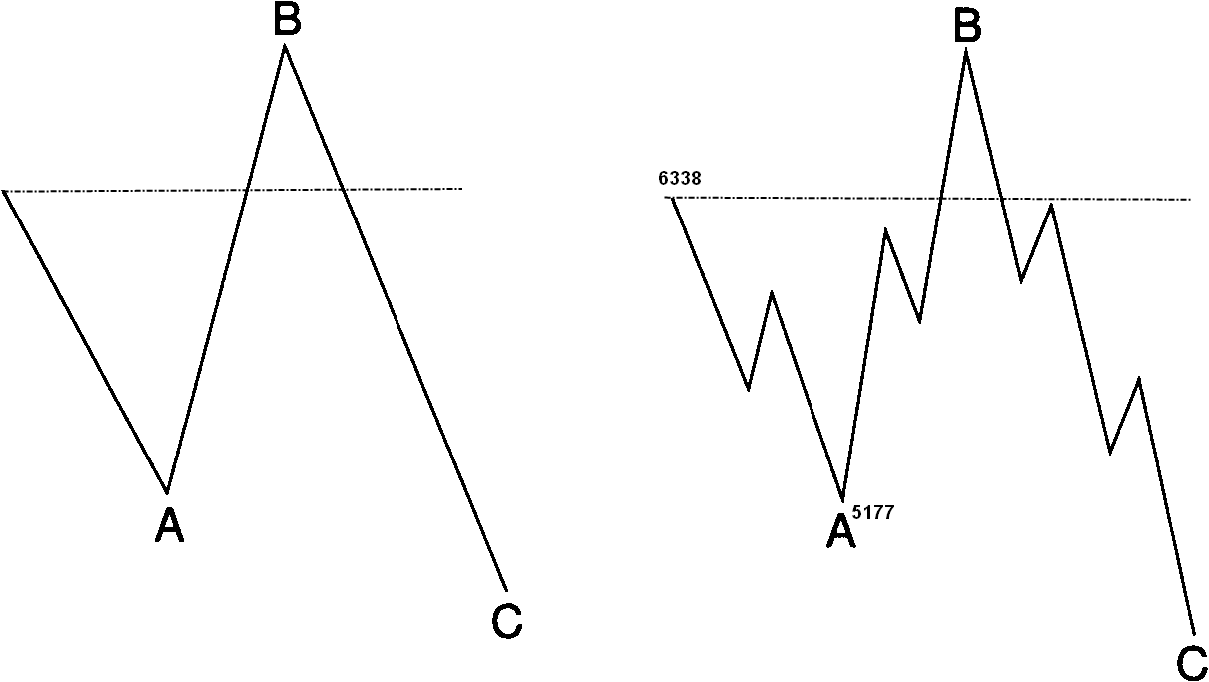
Example
What do you think about the idea that we have seen a leading diagonal wave up and we possibly completed an extended flat?
Example
Fair possibility, Kevin. I might consider modifying your leading diagonal count to reflect your (i) wave at the wick high (vs the expanded "b"-wave) - and the subsequent move down as the "a" of "c" of (ii) or "all-of" the (ii) wave. As always, I recommend framing all such possibilities within the larger framework of one's big picture thesis. Thanks for the chart!
Yes. i realized today that not all exchanges show that wick that labeled B higher than what I labeled (i).
We came awfully close to $7,348 that you called as the last stand.
Indeed we did! Let's see if 7348 can hold and a sustainable meaningful rally of merit is able to manifest from there. ... Unless "candlestick" analysis is being applied, I prefer to use standard bar charts... That's just me...