You are viewing a single comment's thread from:
RE: Bitcoin (BTC) Morning Update: Upper Line of Wedge Breached!!!
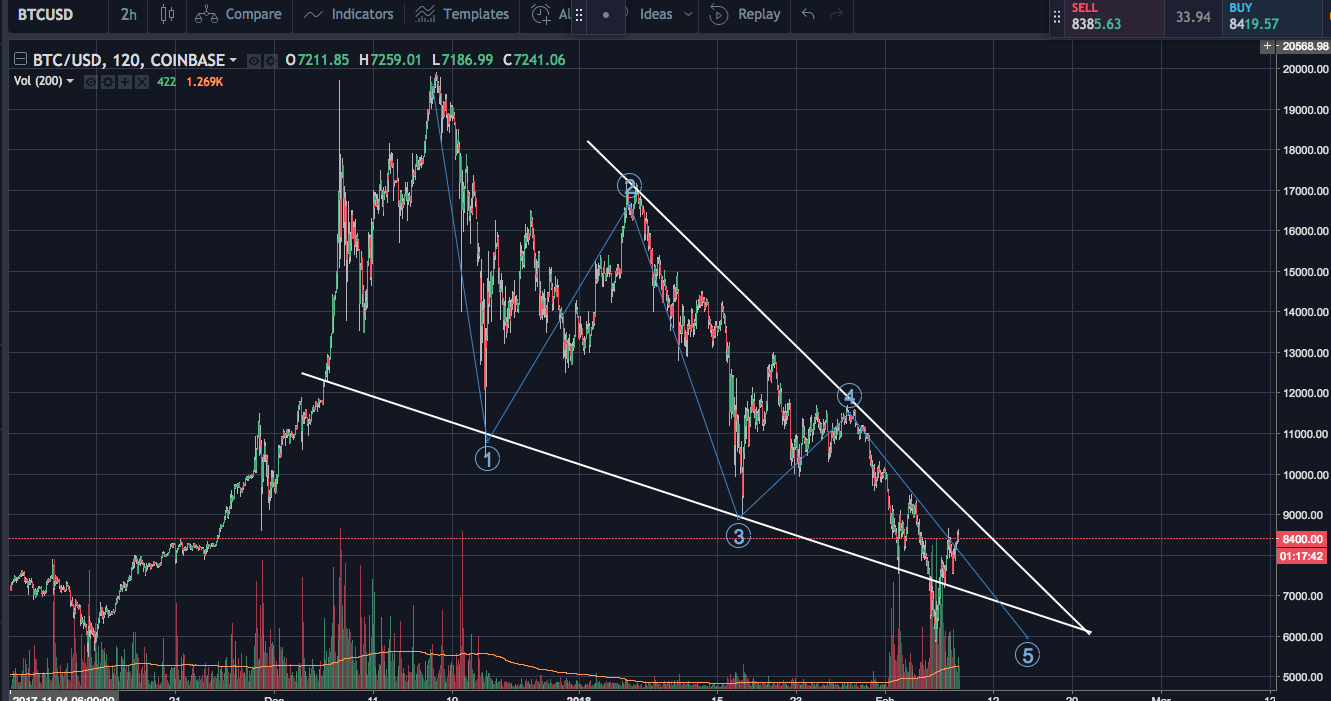
What way are you drawing the wedge? You never zoom out so it is impossible to see. its clearly still inside the triangle. You are a veteran, why are you doing this?
@martinf. If you have a question, ask nicely. You should not be talking like that, very annoying. Nobody has to give you any information, and you are not entitled to get any. You got that? I find some people here are very rude, and have nothing substantial to say, that should not be encouraged!
Couldn't agree with you more. Well said. They should appreciate.
Same on Bitfinex. Price is a good $1200 from the top trendline.
I agree, whatever way I draw the triangle, there is no breach in sight.
Check yesterdays evening update and you will see the complete wedge. The upper line on Haejin's wedge is lower due to the "fake" brakeout at 28.1.2018, that is the reason...
Thanks, I see that now.
I'm sorry, but I'll have to disagree on that one because of the subjective nature of where to draw the wedge. And even if this is a breach of the wedge, it should by no means be labelled as a 'breach' as at this point such a small break doesn't mean anything.
EDIT: Also, look at LTC, the wedge is drawn there much more objectively as it hits the tops cleanly since ath. At LTC you can see there is no means of a breach yet.
I was totally confused by where he'd put the top line of the wedge in this video too. Thanks for the clarification, I'll check out last night's video, as this update made no sense to the lines I had drawn.
But at the same time he said that the apex wasn't until the 24th ... !?!??
I cannot reconcile these two statements no matter how hard I try.
I agree it would be nice to see the zoomed out view but he is using Bitstamp and you are using Coinbase. Could that account for the difference? Just asking, I actually focus on Bittrex.
The wedge was drawn before the dip outside it, following the support lines. Sometimes he uses wicks, sometimes the candles that's why it looks like that. TA is not an exact science. That is why Haejin draws approximations he thinks are the best for him and uses forward conceptualizing to draw his lines free hand based on years of experiance. If you're trying to put exact sciences to peoples greed and fear than its going to be tough.
You must identify your own patterns and use your own knowledge to give you the best picture, as he does.
Watch all his videos, especially the Fibonacci one, it gives very good detailed insight to why he does what he does and how he does it. If you don't agree, thats fine, you can try your own stab at it.
He did draw that line but I saw him move it last week after that sideways movement. He must have moved it back.