Bitcoin Trend Series / EP. 706 / Technical Indicators Show Presence Of Selling Pressure
Time: 8.25 A.M. / GM+2 / 20 Sep 2018 – Thurs.
Recapitulation
- On Daily Chart shown below, no adjustment is needed as we treat the last upside action just as retracement before downside continuation to our major daily target of 5.911K.
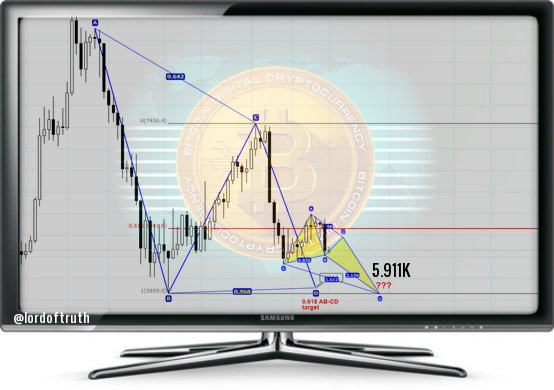
Failure of our Reverse H&S Pattern most likely will lead to drop below the head of the pattern, and it means that market on its way to our daily 5.911 target.
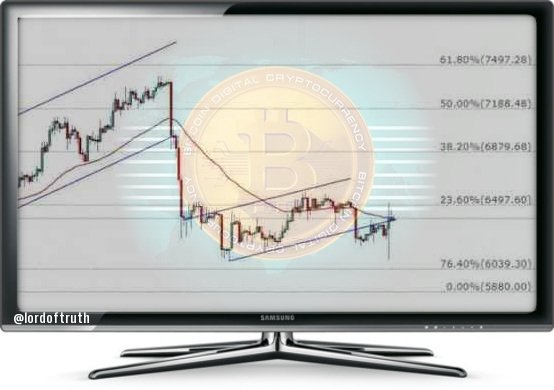
On 4H Chart shown below, Bitcoin price tested the resistance located at 6.500K and keeps its stability below it, so further losses are in the cards as the bearish bias is expected for today unless breaching 6.500K and hold above it, supported by EMA50.
Market Factors
Cryptocurrency prices were mixed as the Australian Securities & Investments Commission (ASIC) said in a statement that it is stepping up scrutiny on misleading initial coin offerings (ICOs).
The pickup in volatility over the past 24 hours is being pinned on short positions building up leading to the SEC decision on the bitcoin ETF Applications from VanEck and SolidX.
Japanese Cryptocurrency firm Tech Bureau Corp said about $60 million in digital currencies were stolen from its exchange, high lighting the industry's vulnerability despite recent efforts by authorities to make it more secure.
Technical
In our previous post / 705 / we had forecast the trading range will be between 5.911K & 6.500K. The intraday low was 6.100K and the high was 6.549K.
Technical Indicators are showing the presence of selling pressure, EMA50 continues to press negatively on the price, Stochastic shows clear overbought signals, while RSI looks ready to turn lower.
We still expect that Bitcoin price to plunge down to 5.782K - 5.911K, the momentum gained from the triggered Stop Orders scattered in the vicinity of support located at 6.040K contributes to this scenario !
Sentiment
unless breaching 6.500K and hold above it.
Support 1: 6040.000 level.
Resistance1 : 6500.00 level.
Support 2: 5911.000 level.
Resistance2 : 6880.000 level.
Expected trading for today:
is between 5911.00 and 6500.00.
Expected trend for today :
Bearish.
Medium Term:
Neutral.
Long Term:
Bullish.
The low of 2018:
5782.00 / Fundamental Barrier / Done.
The high of 2018:
11700.00 / Expected!
The low of 2019:
6600.00 / Expected!
The high of 2019:
25000.00 / Expected!
investing considerable time and effort up front in
hopes of considerable returns down the road.
consider purchasing us a box of beer to BTC Address:
3AmNtmR5F9RkACUyec9wTy2a1EP6B54t66


I also think that bitcoin priced will plunge down
The upside retracement could take different shape but we do not exclude situation of immediate downside action to 5.911K . To conclude, we do not see attractive moments for long entry, and any meaningful pullback would treat as a better price level to short the market.
Useful information, thanks for sharing. Gud luck sir.
CME Futures group playing with bitcoin prices once again
nice npost boss