Fresh Eyes On Bitcoin - Where's It Goin'?
Where You Goin' Bitcoin?
Episodes 15 and 16 of charting the top 10 were pretty bearish (rightly so it seems!), but things now look a little more mixed, with bullish short term charts, but more bearish looking longer term ones too.
Let's see what's what, starting with:
4 Hour Chart = Bullish
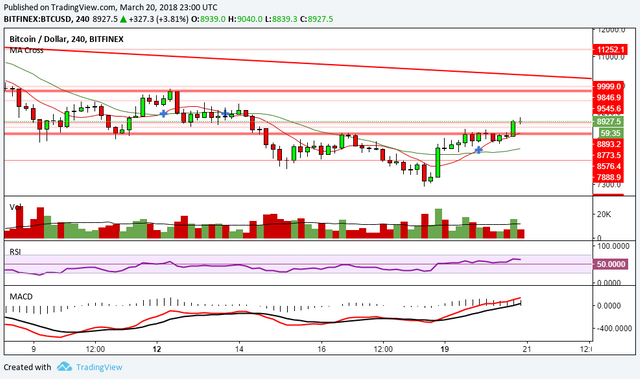
The 4 hour Bitcoin chart looks pretty awesome for the bulls right now.
- MACD is back on the bulls side, and above the signal line
- RSI is back above the 50 level, and not overbought
- MA cross gave a buy signal
The major resistance level at around $8500 has also been breached, and the next level seems to be around $8900.
Things also look good on the...
Daily Chart = Bullish (Almost)
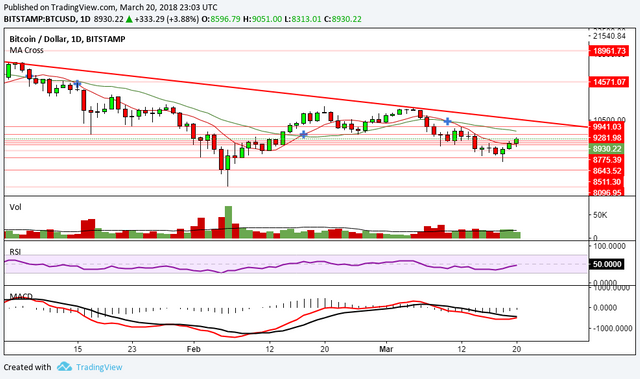
The RSI isn't quite there on the daily chart yet, but the MACD looks like it is about to give a bullish cross here.
I'm still a little concerned though because...
Weekly Chart = Still Bearish
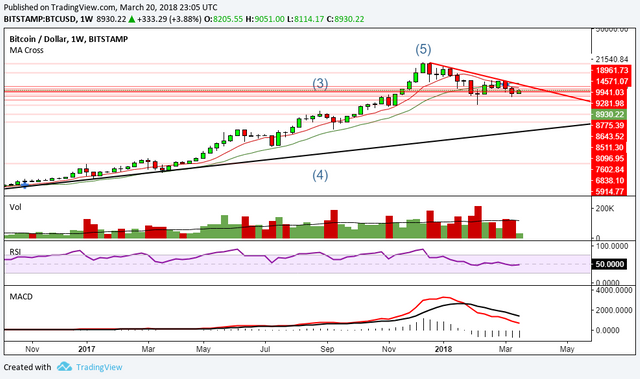
On the weekly chart, while the strength is also almost back to the 50 level here, the MACD remains in the bears favor for the time being.
The weekly chart is obviously slower to react though, so I may be overstating the effect that might have on the BTC/USD price moving forward.
Lastly...
Monthly Chart = No Idea!
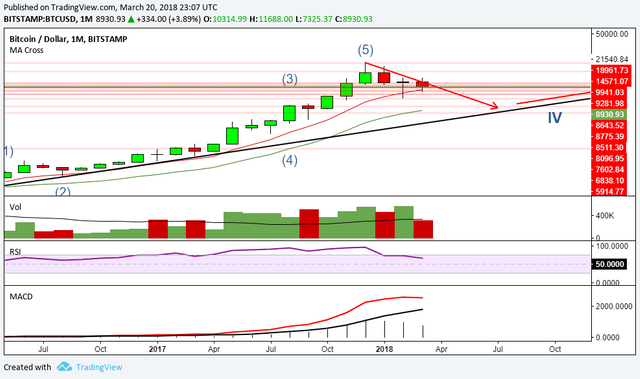
The strength on the monthly chart remains good despite the huge drop, but that MACD still leaves me wondering. But anyone who follows me knows I'm still a new analyst, so I have no idea how that could affect things.
Also of note: That downtrend line with the arrow on the end is only there to show that Bitcoin could drop to $4000 and it would still be in a long term uptrend. I'm not saying it will drop that far at all!
Summary
Things look great on the 2 shorter time frames, but I'm not 100% sure how things will go from here when there are some bearish signs on the 2 longer time-spans still.
I want to be a bull, believe me! But I'm also being cautious too.
Do you get cautious bulls?
We'll see how it goes I guess.
Any thoughts or analysis of your own you'd like let me know about? Just leave me a comment!
Thanks for viewing!
Want more technical analysis and crypto related posts? See also: @toofasteddie, @gazur, @ew-and-patterns, @pawsdog, @cryptomagic, @exxodus, @beiker, @lordoftruth, @masterthematrix, @cryptoheads, @tombort, @maarnio, @steemaze & @briggsy
Not intended as investment, financial, or trading advice. For entertainment purposes only.
In my POV, Bitcoin needs to break over 10k for me to be short-term bullish on all time frames. We kept the log support at 7300 which is a great sign, but breaking the 2 EMAs and hitting 10k should be confirmation. Followed you since I do crypto TA updates as well!
Yeah, that would be a positive sign to see! The $10k figure would break the downtrend line too which would give us another big positive signal.
We'll see what happens! Following you too. :-D
You got a 49.36% upvote from @slimwhale courtesy of @futuristgear!