Charting The Top 10 - Episode #15 - Beware Of Bears
Topsy-Turvy Saturday
Happy Saturday everyone! Or is it? Well, the market was looking pretty nice earlier today, and we're now going for another dip. So there are probably mixed emotions right now.
Let's look at the charts and see what's happening, starting with...
Bitcoin
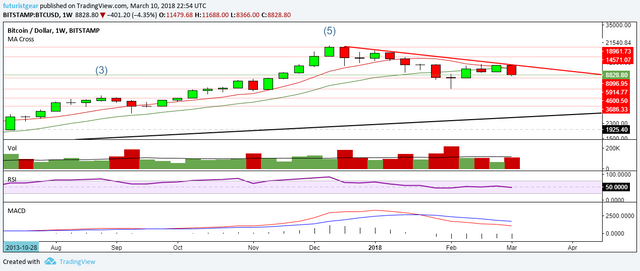
Bitcoin is dragging the majority of the market along with it, so nothing new there then! It also continues to look bearish on the weekly charts.
- The RSI has fallen below 50
- The MACD is still on the bears side
- The MA Cross looks like it is about to give a sell signal, and
- The downtrend remains intact
There is some good news in that we're still $700 away from the next support level at around $8100, but if the indicators remain this bearish it might not be long before that level gets tested.
If that level fails, the next clear level of solid support (on the weekly chart, there are others) is at $6000, or right around the prior crash low.
I'll say it again in the summary section, but some positive news can always reverse the bearishness being shown here right now. If it can get back to bullish, the major resistance on the weekly chart remains the downtrend line.
Ethereum
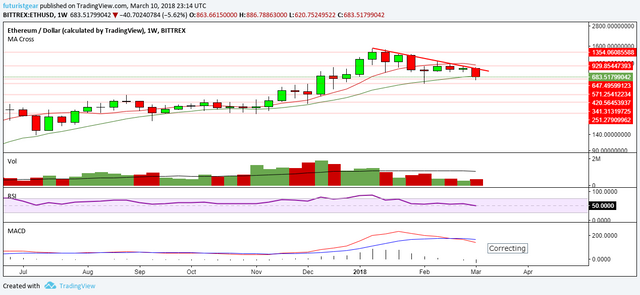
The story is much the same for Ethereum, although the RSI is a tiny bit stronger but still around the 50 level.
ETH tested its support level at $647 once again, but it is currently holding above that level as I type. If it were to fail, then there is another level of support found at $570. Like BTC, resistance here is also in the form of the downtrend line should things turn bullish.
Ripple
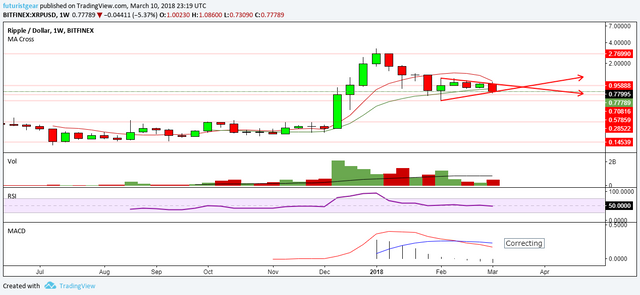
Ripple looks weak too, but there is a symetrical triangle forming which might just provide it with a lift. Although with similar indicators to BTC and ETH still in play (I.E. bearish), a further drop here wouldn't surprise me either.
Support can be found at $0.70 and around $0.58 (the prior low) if it needs it.
Resistance will be found $0.95 if it can breakout the top of the triangle.
Bitcoin Cash
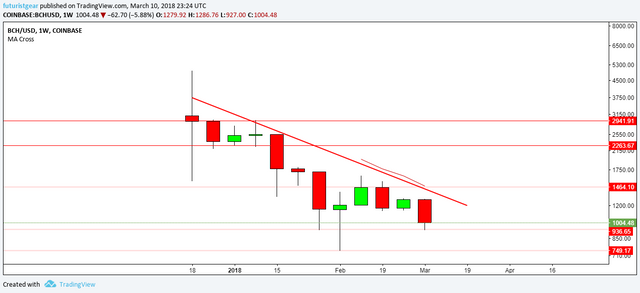
There's not a whole lot of data on the BCH chart (I'm using the Coinbase one here) but what we can see is there is support at about $936, and also $750 if it needs it. With 2 resistance levels at around $1200 and the downtrend line (which looks wrong here) still in play too.
Litecoin
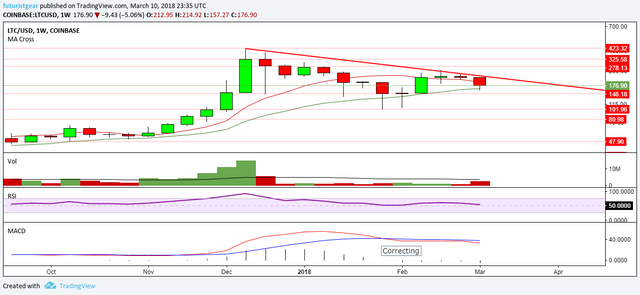
Things look familiar here too, RSI and MACD much the same as BTC and ETH, with supports at $150 and $100. Resistance is at the downtrend line if the bulls can return.
NEO
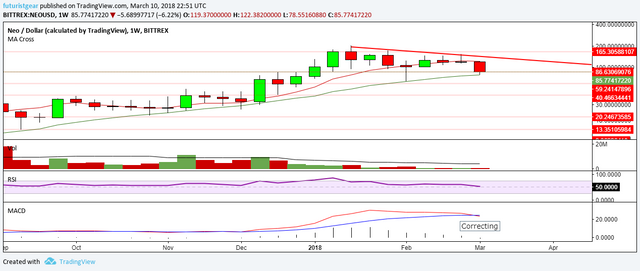
NEO also looks similar to BTC, ETH and LTC, but the MACD looks like it has only just started correcting here.
The key level right now is at around $86/$85, an area which is playing with as I type. Should that fail to hold, there is a support zone that begins at around $66 and ends at 59 bucks or so.
Resistance remains at the downtrend line if the bulls come back. (I wish they would!)
Cardano
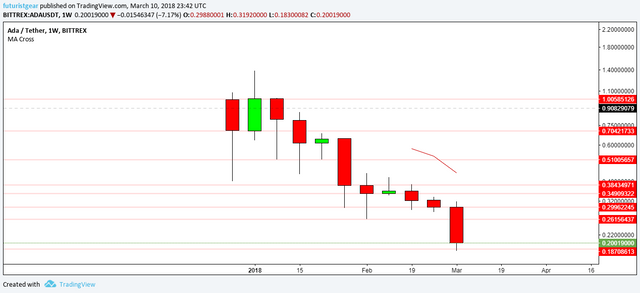
ADA is also too new to be charting on a weekly basis, but it's probably safe to say that it will follow the rest of the top 10 barring any major positive, and that a downtrend is clearly in play.
If the bulls can return, resistance is at 26 and 30 cents, with support seeming to be at about 18c
Stellar
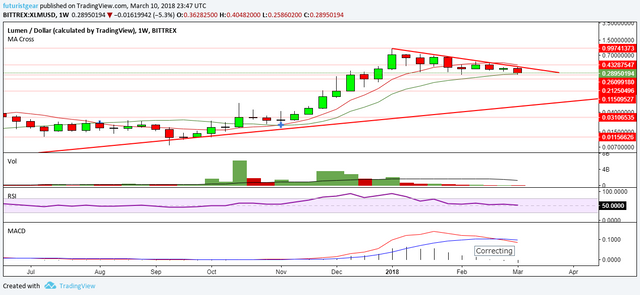
Stellar is holding up above support at $0.26 for now, but it looks to be correcting on the MACD here, and it has lost some of its strength, but remains neutral for now.
If the bearishness on the MACD remains, that level could be broken and the next support at 21c or so will be the next key level to keep an eye on.
If the bullish momentum returns, the downtrend line is the main resistance area in its way.
EOS
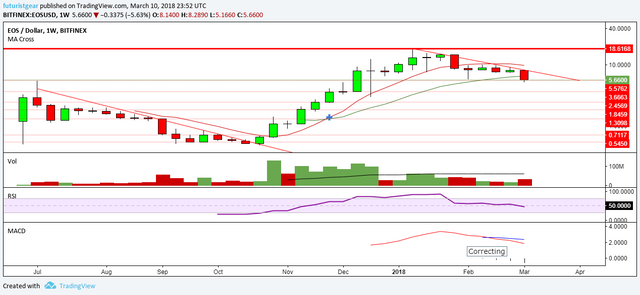
EOS = Bearish too, which isn't surprising. What is interesting though, is that the prior all time high of around $5.70 is currently acting support. This was the price not long after the ICO began.
The MACD is lacking some data here, but we can see that it is in the bears favor right now, and the support level at $3.66 might come into play if it remains that way.
Lastly...
Monero
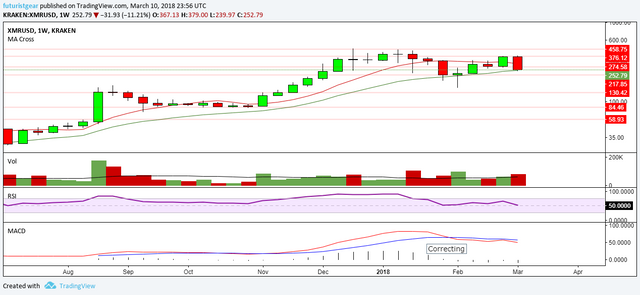
Monero has been one of the stronger coins of late, but that too is on the bearish side on the MACD too.
The current candle has poked through the $275 support zone, and the next support at $217 may be needed if it continues correcting further.
As with all the other coins, should some good news come along, and another bull run kick off, then the nearest resistance on the weekyl chart isn't until $375.
Summary
Since I'm looking at the weekly charts here, my outlook may not take into account any oversold bounces that are likely to occur along the way, like the period of green we saw earlier. I guess it depends on what time-frame you want to play with. There is likely to be some more of those bounces, but the weekly/longer-term charts are all looking bearish to me.
NOTE: There will also be some short-term support/resistance levels missing here too!
Always remember I'm still new at TA. There's also the possibility we'll see some good news come from somewhere (perhaps China?) at some point, and that could have the opposite effect of the FUD we've had this past week.
Take care, and thanks for viewing!
Want more technical analysis and crypto related posts? See also: @toofasteddie, @gazur, @ew-and-patterns, @pawsdog, @cryptomagic, @exxodus, @beiker, @lordoftruth, @masterthematrix, @cryptoheads, @tombort, @maarnio, @steemaze & @briggsy
Not intended as investment, financial, or trading advice. For entertainment purposes only.
For future viewers: price of bitcoin at the moment of posting is 8670.00USD
^--- You made this exact same comment at least 6 times and close variations at least 70 times in the last 1 hour. View these duplicate comments
Upvote this comment to support @duplibot and help reduce spam and superfluous comments.
You got a 32.40% upvote from @redlambo courtesy of @futuristgear! Make sure to use tag #redlambo to be considered for the curation post!