Bitcoin Rainbow Charts
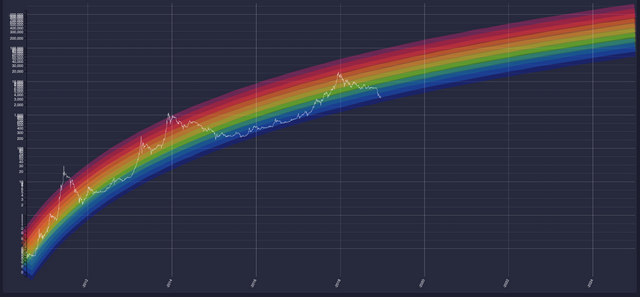
Moonmath.win displays very interesting equation and stats which projects future Bitcoin prices. As you can see BTC has moved greatly within the rainbow in the past few years.

The past year's bull-run is also contained well within this rainbow. Infact it doesn't look as aggressive as some of the past runs inspite of the larger value of the token.

It's also worth noting that the chart displays the rainbow reaching $1M price point around 2025. That's about 6 years from now. Will Bitcoin reach that price? We'll just have to wait and watch.
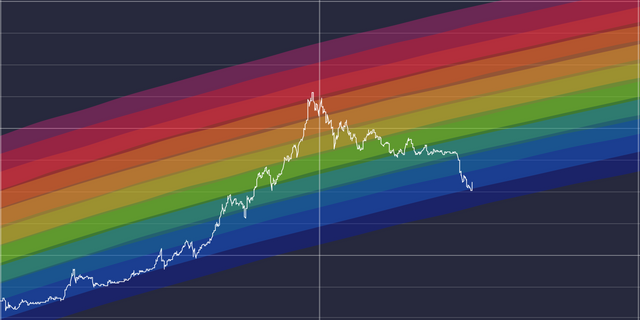
However, the spike from the slight pump over the past two days is visible in the 2nd screenshot above.
You can visit the website for more information, math equation etc.
I've been watching this chart for a few days and so far it has been quite pleasing to the eye watching Bitcoin move in this range. So far BTC has shot over and above this rainbow but never really under it. If it were to fall below $3k and close to $2K it would be come out of this 'rainbow projection.'
What are your thoughts about these projections?
If you like my work kindly resteem it to your friends. You may also continue reading my recent posts which might interest you:
- Let's Watch This Fun Video From International Steem Meetup #1—Malaysia
- Why You Should Vote For Firepower As Witness—Witness Campaign Post From India!
- Steem.Chat Contest #57
I think I have never seen a more beautiful rainbow. !tip
@firepower, First of all these Rainbow charts are really attractive to go through. And in my opinion the Bitcoin prices can jump to higher dimensions because, Institutional Investors are waiting to enter and in my opinion they will make use of this downfall for sure because somewhere it's reflecting as they wants upper hand in this Economy and not others because it can hit their reputation if they face the super volatility. So let's hope for the best and in interest of Decentralisation and Blockchain Technology. Stay blessed. 🙂
Posted using Partiko Android
I have no holding in bitcoins. I do really believe that Bitcoin can reach $1M and beyond. So the price of steem can also be contained in such a curve, right?
Btw, just a suggestion. Always keep some BTC and try to increase your holding. It makes and moves the market and everything in it including STEEM.
Sure bro. Before that I want to go through materials regarding how to safeguard these holdings.
Maybe someone good with math can give it a shot. It would be nice to see something similar for STEEM.
Steem has a much much shorter history, just about 2.5 years. Not much data yet for a similar charts
First of it is kind of cute :) I kind of believe crypto is here to stay, but I am not that sure that bitcoin will go to millions in only 6 years. Maybe to 100.000 :)
Posted using Partiko Android
In 2011 bicoin was around 1 dollar. So in next 6 years anything is possible.
Hard to say which way it will go. Speculative markets are like that. I don't get into predicting anything. But I just find things like this quite interesting even though I don't read too much into it.
Great reply!
The Million Dollar Rainbow :D
Bitcoin holding and wait market movement.
Good update and advise.
Posted using Partiko Android
The first spike did break the window a little but overall it is eye pleasing to see that chart fit into the rainbow shape. And it is saying we just need about 10 more years to hit the 1M BTC price? Thrillin definitely!
It can be 10, or 50, or maybe as little as 5-7 years till $1M. Nobody knows tge future, but all 3 scenarios quite possible
It's good news for crypto market
Posted using Partiko Android
🎁 Hi @firepower! You have received 0.1 SBD tip from @onealfa!
@onealfa wrote lately about: Wednesday Morning Feel free to follow @onealfa if you like it :)
Sending tips with @tipU - how to guide :)
Hope there is a pot of gold at the end of the rainbow
I would say rather than pot if gold - a coffin for all central banks. This is the best what can happen to this planet