Bitcoin TA - summary of analysts - 30. May 18
Regular daily update on BTC ta analysts opinions.
**My summary - short-term sentiment: neutral ** (last: bearish)
- Critical support 7'000 - 7'200 bounced us.
- We got 4 updates today. Two analysts turned bullish - two confirmed their bearish view despite the current bounce.
- So again we are in uncertain territory. Is this a short live dead cat bounce or a turnaround point?
- If we don't break in this move 10'000 the likelihood of seeing new lows is increasing significantly.
News about the blog
I need to revise my 2018 long term table. I need to add a 2018 and 2019 target an be more precise on the sentiment here. Will do that after I am back in Switzerland.
We lunched the bounty project beta. If you are interested and you like to create a bounty on your own have a look at this post
Analysts key statements:
Tone:
- Weekly:
As long as we stay below 50 MA weekly which is at 7'709 we are fully in line with "Busting" a price bubble. - Daily: If we close below 7'330 on tomorrows candle we get a 9. Even though bitcoin reversed several times on a 8. Volume is low. If this is a reversal he sees us to retest 8'000 and go down from there.
@haejin:
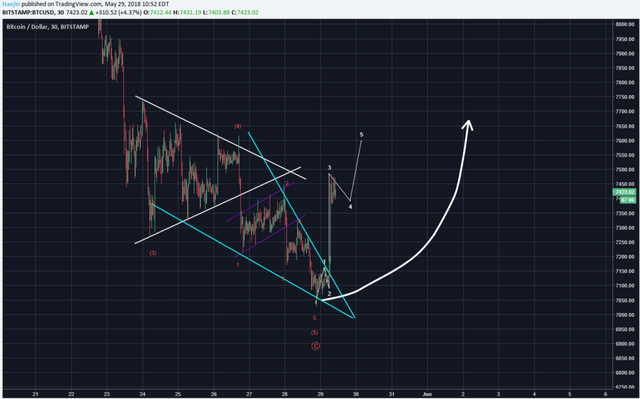
The below chart shows that the ending diagonal was shorter than projected. The blue lines outline the last remaining five waves down as an ending diagonal; which is fitting for a wave 5 of C corrective sequence. The burst in price is taking an impulse sequence as shown by the white wave labels. Is the correction complete? Let's take a look at the longer term.
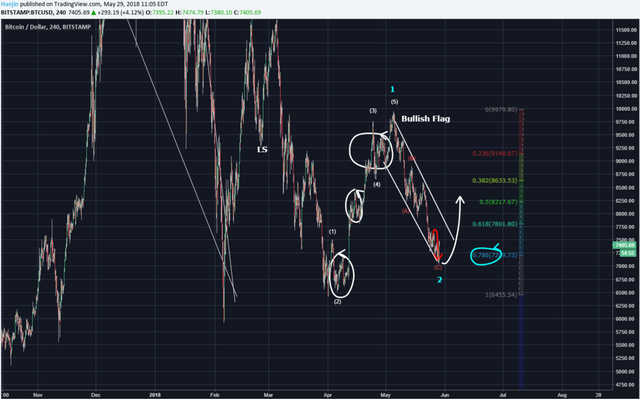
Price exceeded the 0.78 Fib level slightly as had been discussed over the past several days. The bull flag is also likely to be executed to the upside price action. I believe the correction is likely complete but the breakout needs to be confirmed. Confirmed how? The earliest steps that needs to be taken are the price needs to breach the upper white line of the bull flag (white arrow) and do it impulsively. So, let's follow the price action this week to see how that plays out.
@ew-and-patterns:
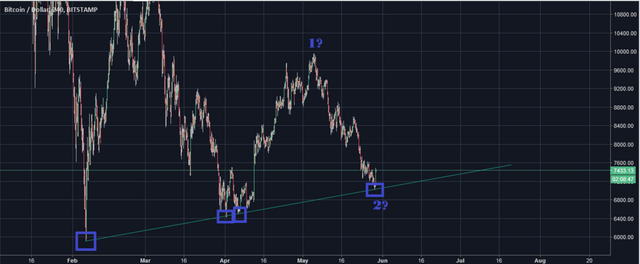
We bounce of a trendline which established itself as new trend line.
@lordoftruth:
Looking at the weekly chart, will see that bitcoin price has failed to reach 10'158 and turned down, and the 2 weekly bearish stop grabbers ( G seen on chart ) after breaking 7'614, suggest drop below 6'519, to test 5'878 reaching 4'300 area, where Long Term Traders Should Wait this level as potential bullish reversal.
The bearish trend remain valid conditioned by stability below 7'910 and the most important level at 8'643.
Todays trend is bearish. Trading between 6'915 and 7'910.
@philakonesteemit:

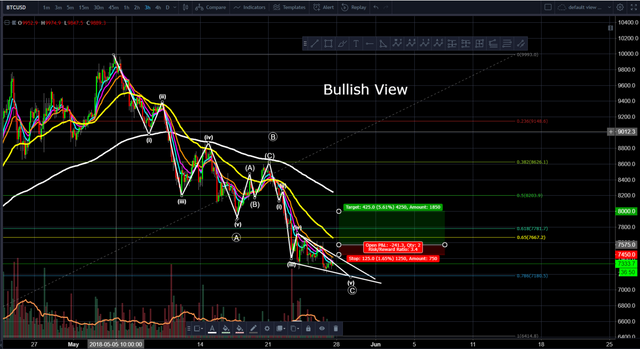
The bearish view: A break below 7'200 range, we'll certainly test 7'000, where if that doesn't hold, 6'450 is the next range of support.
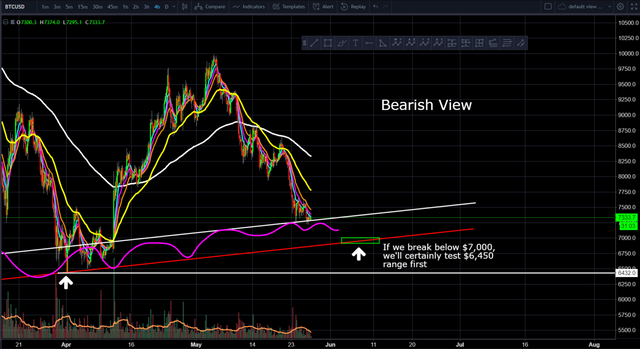
The bullish view: A break above 7'650 range and we can test the 8'000 range first.
@passion-ground:

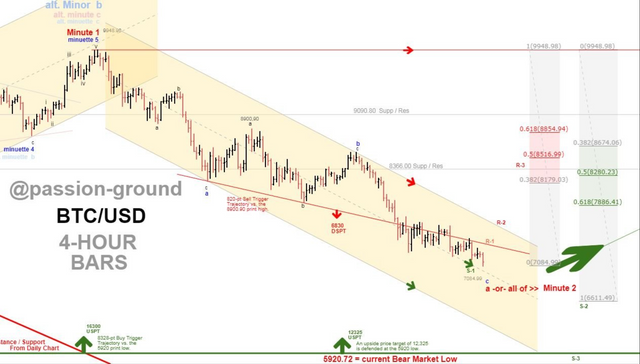
At present, BTC can’t get out of its own way. So, where is the bottom? He sees 6'830 as a possible bottom.
Summary of targets/support/resistance
Reference table
| analyst | latest content date | link to content for details |
|---|---|---|
| Tone Vays | 29. May | here |
| @haejin | 29. May | here |
| @ew-and-patterns | 29. May | here |
| @lordoftruth | 30. May | here |
| @philakonesteemit | 28. May | here |
| @passion-ground | 29. May | here |
Definition
- light blue highlighted = all content that changed since last update.
- sentiment = how in general the analysts see the current situation (bearish = lower prices more likely / bullish = higher prices more likely)
- target = the next (short term) price target an analysts mentions. This might be next day or in a few days. It might be that an analyst is bullish but sees a short term pull-back so giving nevertheless a lower (short term) target.
- support/res(istance) = Most significant support or resistances mentioned by the analysts. If those are breached a significant move to the upside or downside is expected.
- bottom = -> now renamed and moved to long term table. Low 2018
- low/top 2018 = what is the low or the top expected for 2018?
Further links for educational purposes:
- From @ToneVays: Learning trading
- From @philakonecrypto: Like in every post you find links to his amazing educational videos. For example here
- From @lordoftruth: Fibonacci Retracement
- From @haejin: Elliott Wave Counting Tutorial
*If you like me to add other analysts or add information please let me know in the comments.




Hello my dear i hope that you're good and everything's fine with you. By the way this is a humble gift for you hope you accept it. https://steemit.com/@soufianechakrouf/a-gift-for-famunger
Please upvote my posts please....
I agree it's confusing but I see all their predictions very well connecting:
As I understand it ew sees us testing 10'000 and if we break we are back in bull market.
Haejin sees uns breaking out of MACD wedge - he looks for confirmation of this breakout but basically thinks that we might go back up from here (if confirmed).
So I don't see them too much aligned here as Tone and Lord see further downside to be highly likely.
But of course there is also some overlapping of their opinions as you stated very well.
Interesting... That scenario doesn't sound impossible at all.
It is very clear to those with market experience that a bottom has not been made, until you see some major panic. Expect bounces but lower. See my posts. Been the only major bear on steem for multiple months.