Bitcoin TA - summary of analysts - 21. Mar 18
Regular daily update on BTC ta analysts opinions.
My summary - short-term sentiment: slightly bullish (last: slightly bearish)
- We are still on the way up and most of the analyst expects us to go into the 10'000 area.
- Still we need to clear 10'000 downtrend and the previous high of 12'000 to confirm a full blown turn around.
News about the blog
- None
Analysts key statements:
Tone:
- Weekly: Price is back above 9'000 which is good. But still he sees it neutral.
- Daily: If we would have close below 7'500 he would have been very bearish. We are now going up very quickly which will delay the death cross (50 / 200 MA). That may lead to update his arrows. We need to break 50 MA which is very important. It still all be a dead cat bounce.
- 4hourly: Is flattening out setting up the environment for another move up towards the 200 MA (4 hourly).
@haejin:
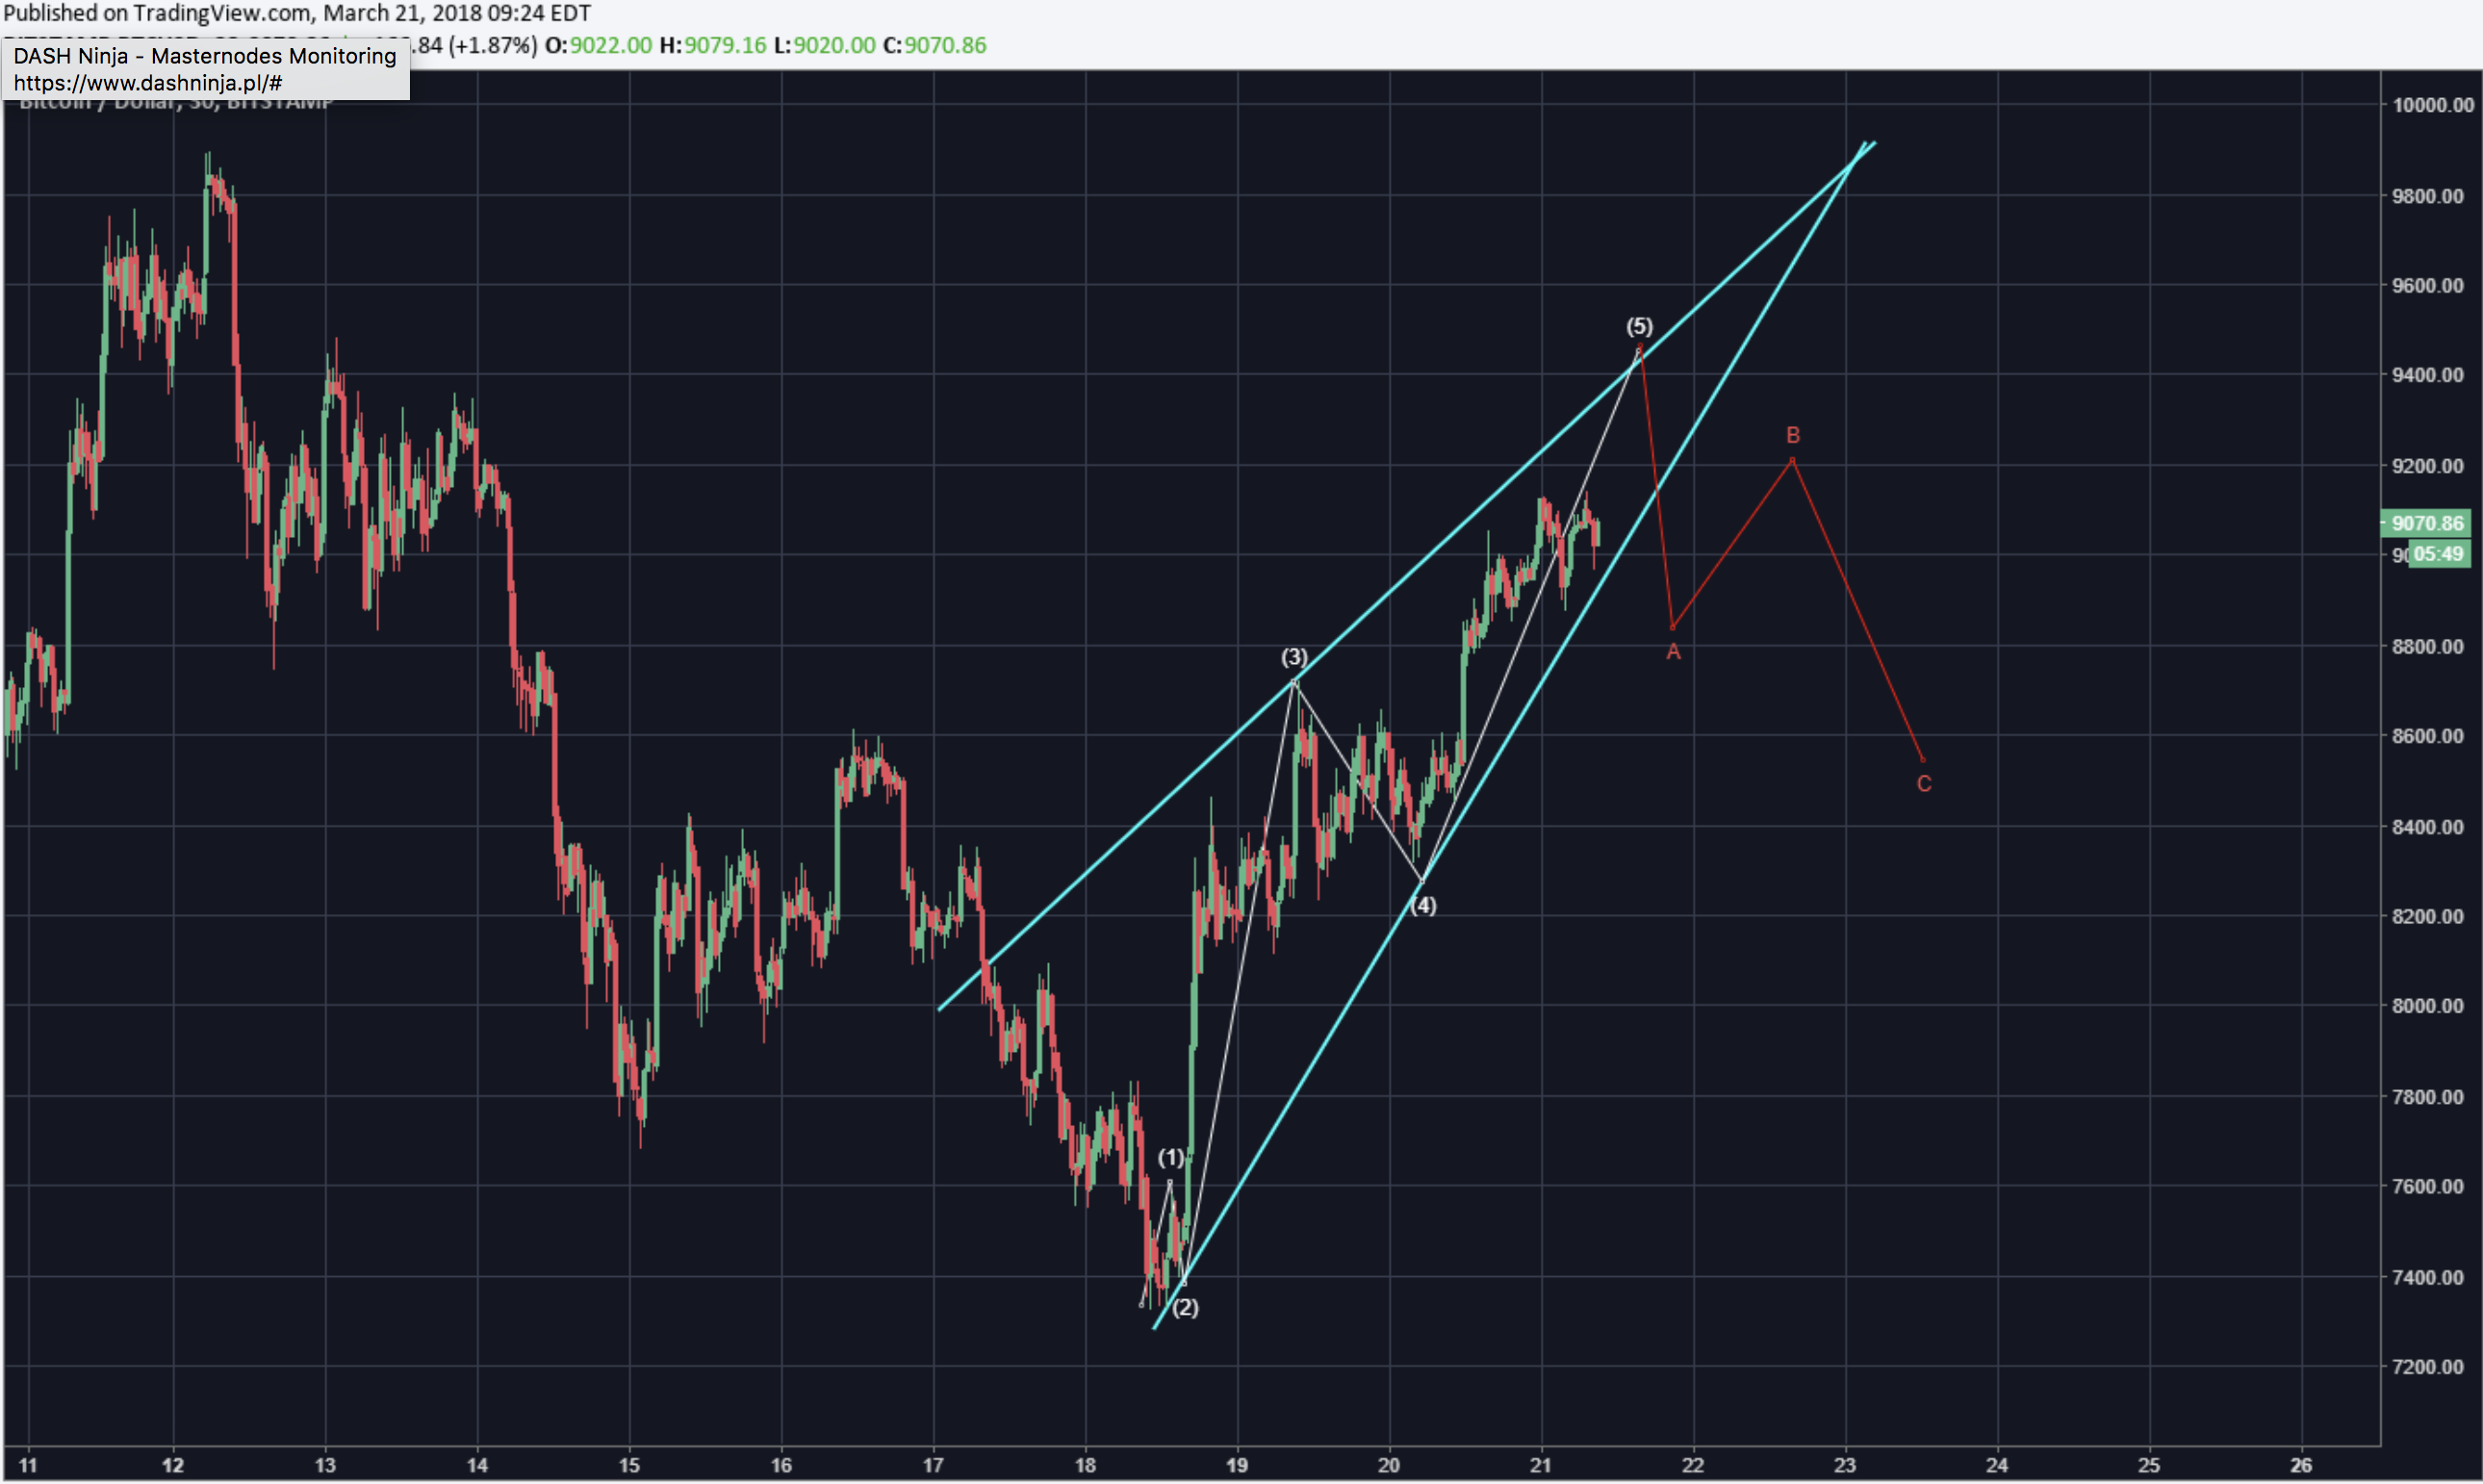
He sees iSHS pattern confirmed as price breached neckline and stayed above it. Also volume confirms pattern. Minimum target for this is 10'387.
Alternate count is that we are in a wedge followed by an abc correction towards 8'500.

@ew-and-patterns:

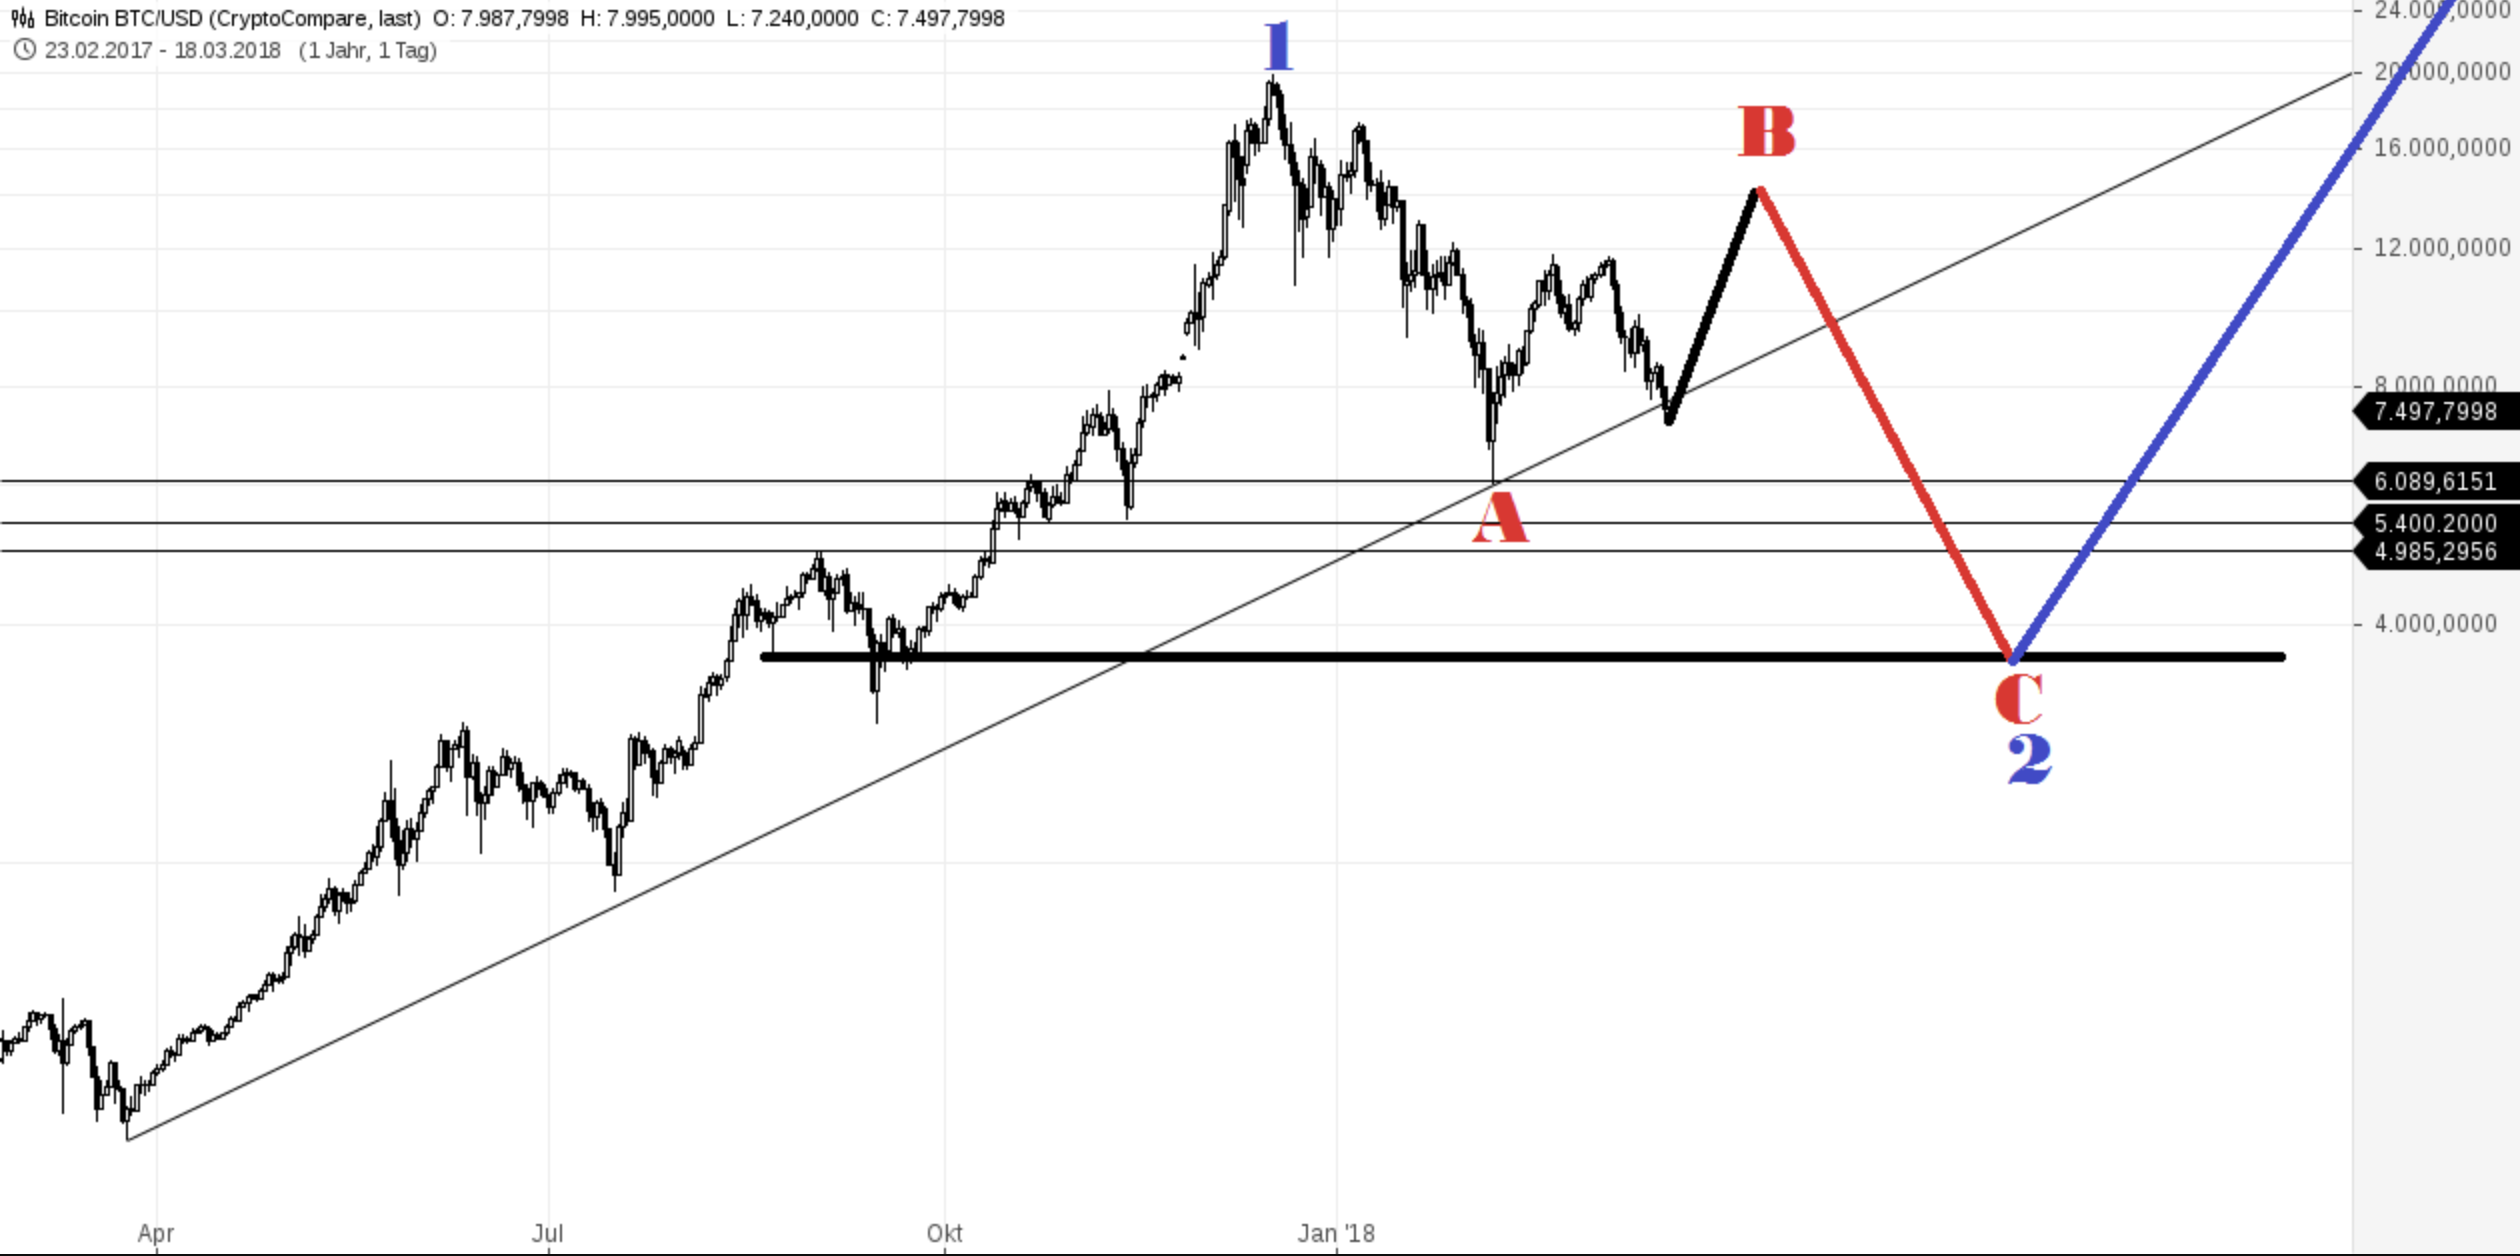
He presents an alternate count for awareness reasons. That one has a target for correction wave C of 4'000.

@lordoftruth:
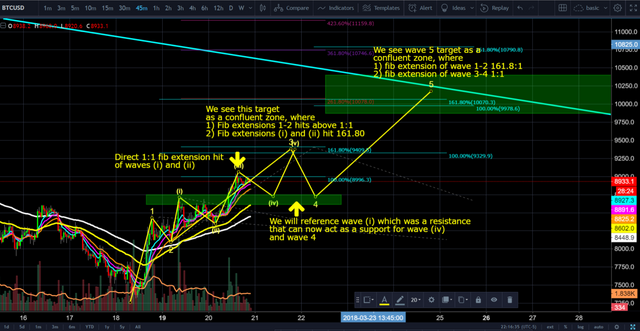
Second jump into the 9'000 ish price levels came as expected. Now he expects a third push towards 10'150. There might be a pull back to 8'500 before third move.
Todays trend is bullish. Expected trading for today is between 8'200 and 10'200.
@philakonesteemit:
He sees us getting up to 9'355 and afterwards to the 10'000 area. Before he sees a correction with two possible scenarios: going to 8'890 or somewhere between 8'800 and 8'700.

@passion-ground:
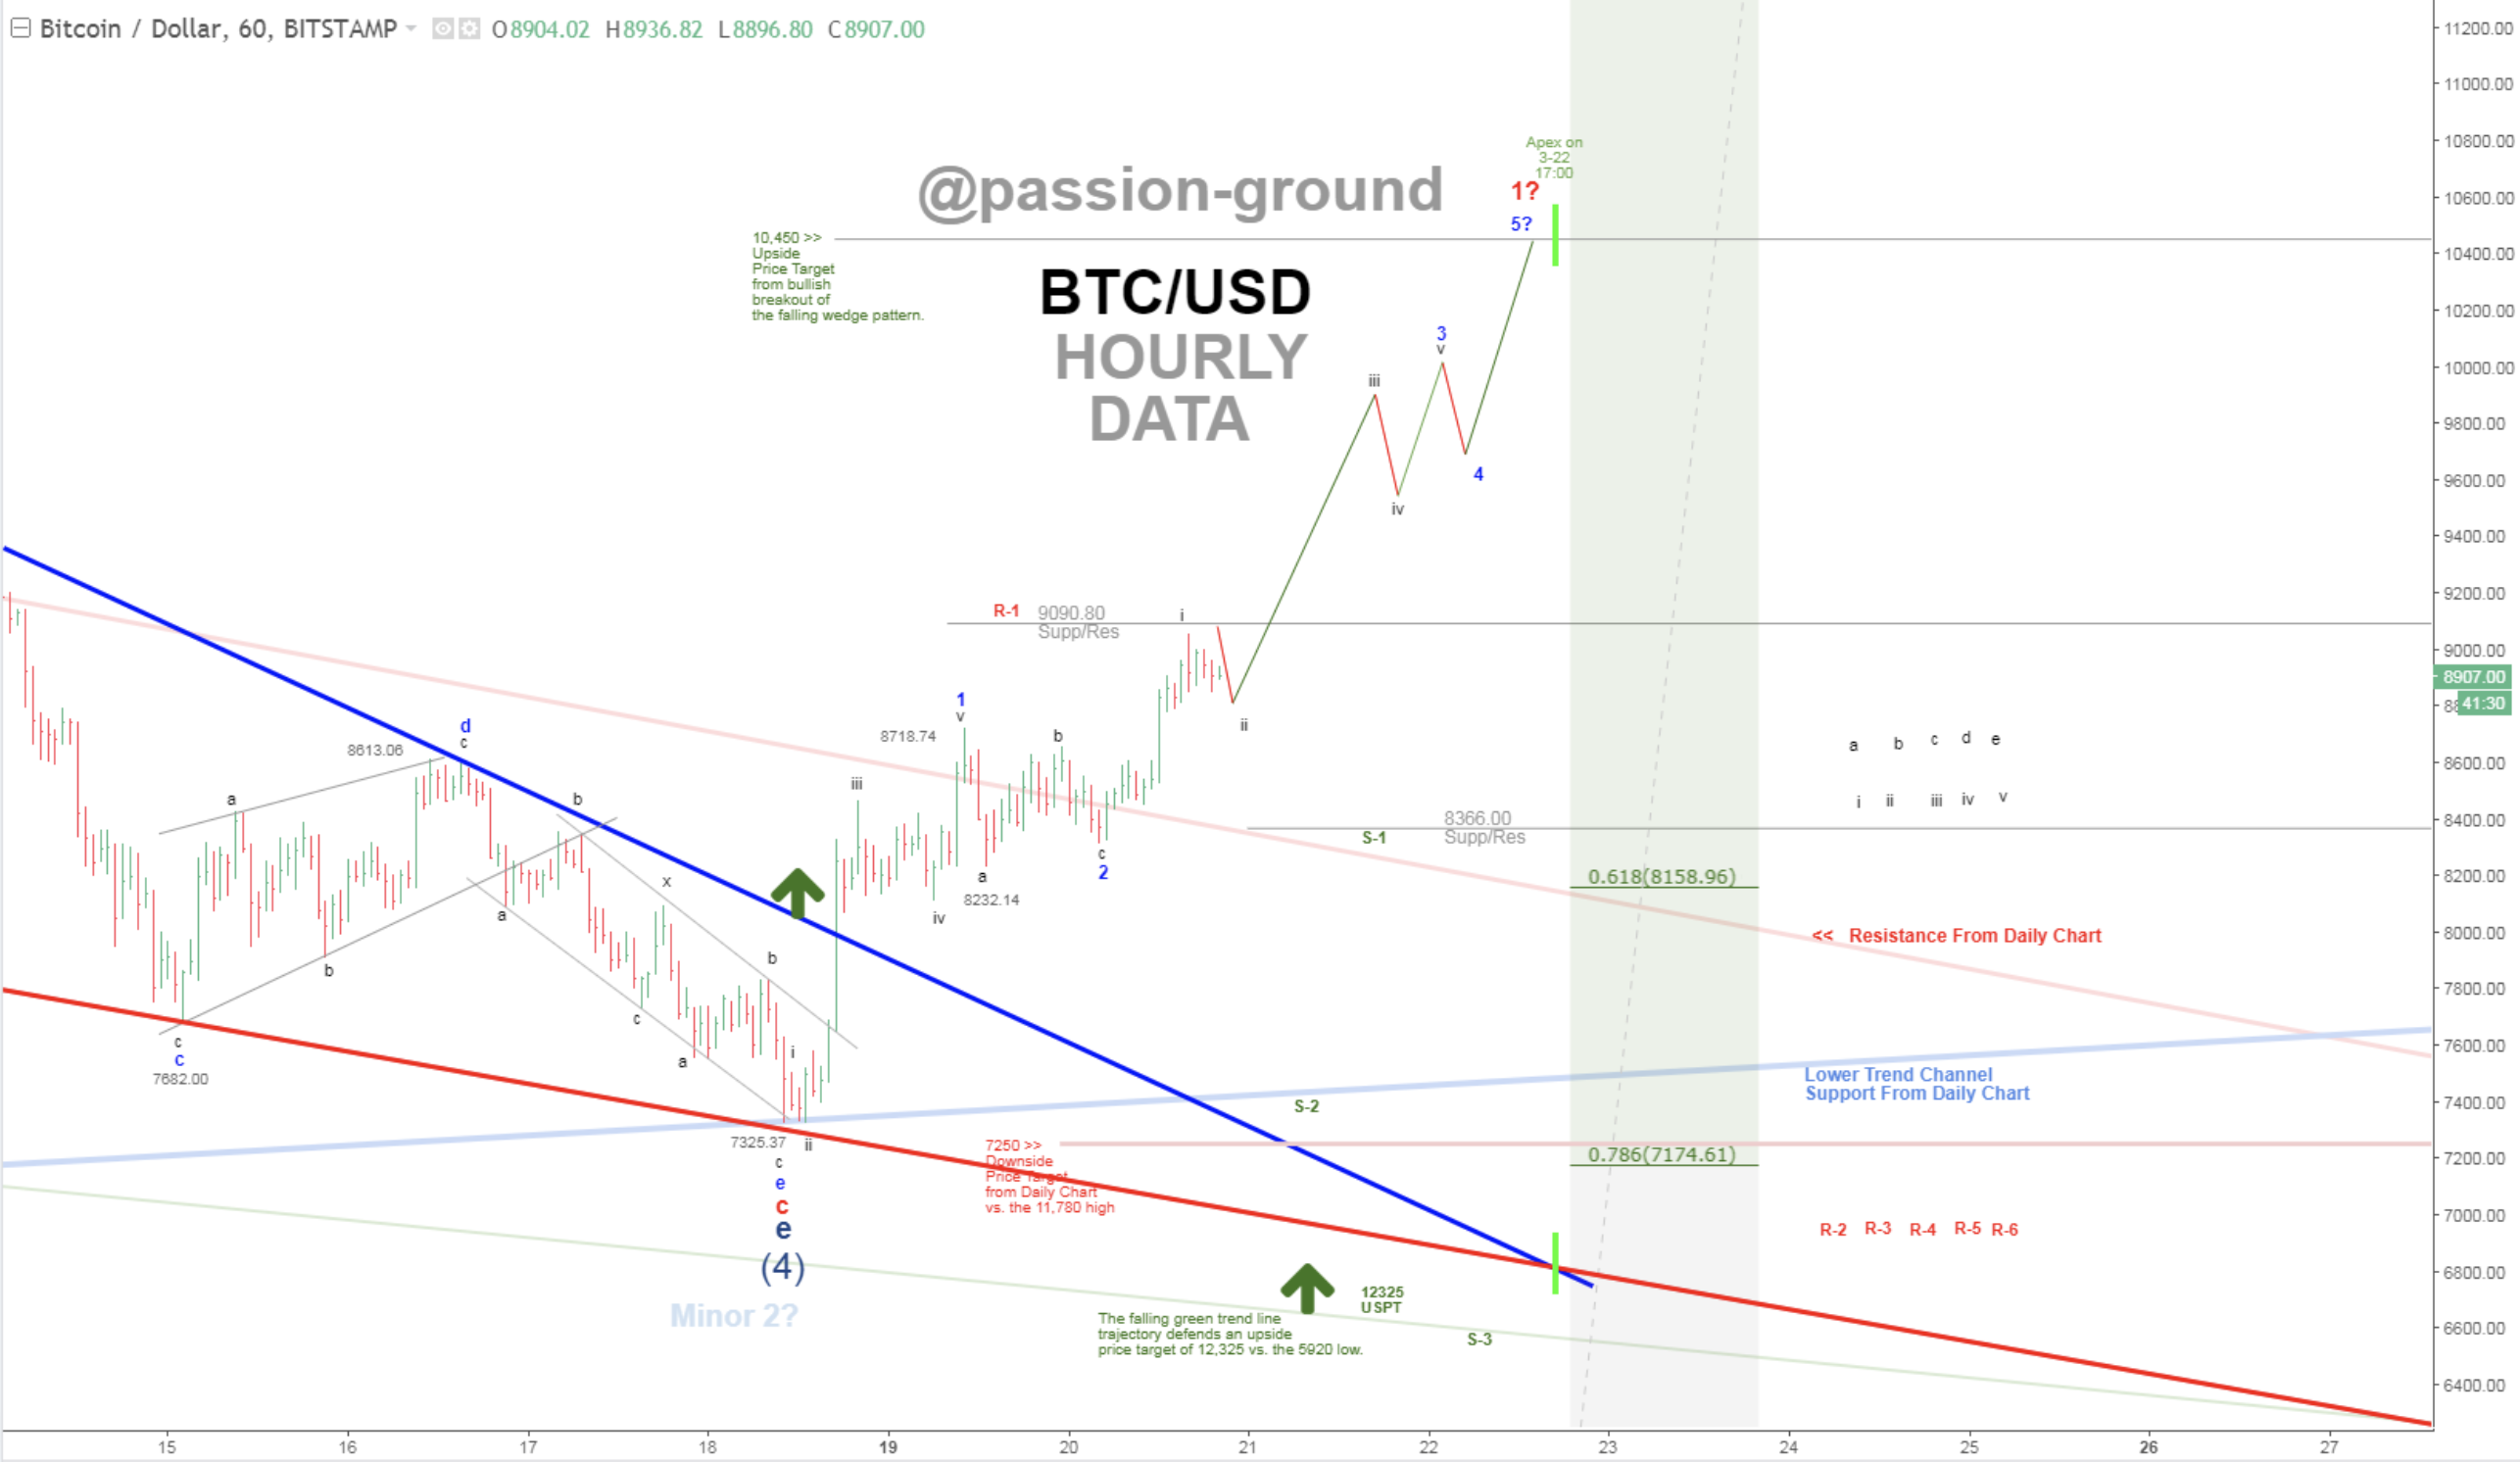
He sees current move off 7325 as solid. Next resistance to hi is at 9'090. The corrective downward move from 8'718 was rather shallow which is a bullish sign supporting the current momentum. He sees the move up towards 10'400 range. His target and support/resistance remain unchanged.

Summary of targets/support/resistance
Reference table
| analyst | latest content date | link to content for details |
|---|---|---|
| Tone Vays | 21. Mar | here |
| @haejin | 21. Mar | here |
| @ew-and-patterns | 18. Mar | here |
| @lordoftruth | 21. Mar | here |
| @philakonesteemit | 21. Mar | here |
| @passion-ground | 21 Mar | here |
Definition
- light blue highlighted = all content that changed since last update.
- sentiment = how in general the analysts see the current situation (bearish = lower prices more likely / bullish = higher prices more likely)
- target = the next (short term) price target an analysts mentions. This might be next day or in a few days. It might be that an analyst is bullish but sees a short term pull-back so giving nevertheless a lower (short term) target.
- support/res(istance) = Most significant support or resistances mentioned by the analysts. If those are breached a significant move to the upside or downside is expected.
- bottom = -> now renamed and moved to long term table. Low 2018
- low/top 2018 = what is the low or the top expected for 2018?
Further links for educational purposes:
- From @ToneVays: Learning trading
- From @philakonecrypto: Like in every post you find links to his amazing educational videos. For example here
- From @lordoftruth: Fibonacci Retracement
- From @haejin: Elliott Wave Counting Tutorial
*If you like me to add other analysts or add information please let me know in the comments.


Most of these analysts rely heavily on EW. Any chance we can get more diversification?
Does anyone see this probability? Could this be the Bearish scenario of the Big Picture??!
Different counts but similar to Ew-and-Patterns predictions. freaking scary screnario however quite possible. As lots of TA do mentioned the correction is not finished.
Perhaps if your (4) was over the to next wave to the right, it would look more symmetrical and waves 5 & 3 would line up in parallel, which helps in validating patterns. At this stage your Bearish scenario seems possible but it would imply breaking the long term support line which it already bounced off a few days back. My pref view is this is beg of Wave 3 up after a .76 retracement to Wave 1, but admittedly it is beginning to look weaker every day that passes...
Congratulations @famunger! You have completed some achievement on Steemit and have been rewarded with new badge(s) :
Click on any badge to view your own Board of Honor on SteemitBoard.
To support your work, I also upvoted your post!
For more information about SteemitBoard, click here
If you no longer want to receive notifications, reply to this comment with the word
STOPThanks you. Good information. Greeting me from world east.
Hey, Your english is far better than my anything else. Your comment would make more sense to english speakers if you said it like this.
"Thank you. Good information. Greetings from the east."
English speakers wouldn't say it exactly like that but I tried to change your words as little as possible. I wish I could speak your first language that well. Keep up the good work!
You shared a great information ... the post really liked me ... and I hope you share this type important post in the future.
thanks for summary
wow the best information..i like this post..