Bitcoin TA - summary of analysts - 16. July 18
Regular daily update on BTC ta analysts opinions.

**My summary - short-term (next 24h) sentiment: neutral ** (last: neutral)

- We probably going up either for a short term dead cat bounce or another impulse on a higher low.
Bull scenario*:
- We break through the major resistance of 6'839 - the bottom of the triangle.
- We get follow up breaking through 7'050.
- Volume increases in spikes.
- We go towards the 30/50 week MA and break above it.
Bearish scenario*:
- Recovery one more time to a new lower high at around 6'500 and than drop below 6'000.
- Alternate: We go up into the deathcross of the 30 and 50 MA weekly which will be at around 8'500 around beginning of August and than drop significantly.
- After breaking 5'800 a significant drop towards new lows in the range of 4'975 and 4'300.
*scenarios based on daily-candles - so around 4-14 days timeframe. See also definition section
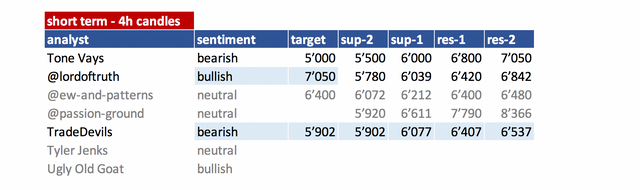
Summary of targets/support/resistance of TAs
Short-term overview
mid- and long-term overview
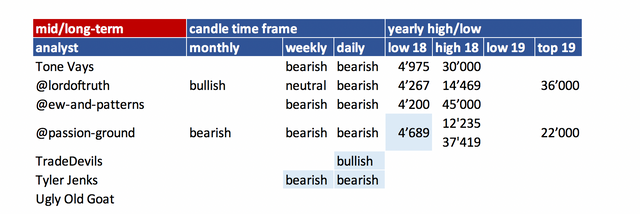
- please refer to definition section for time-horizon.
- you can easily spot which analyst did an update
(block writing - grey ones don't have an update today).
Their changes are in light blue.
Helpful statistics:
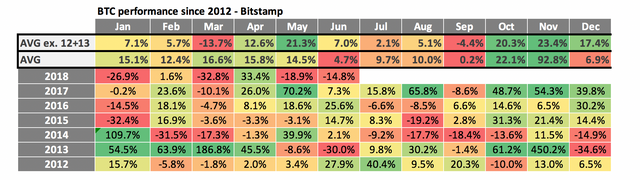
monthly performances
- Added 2012 + 2013 on request.
- As 2012 and 2013 the % move are gigantic I added two averages. One without 2012 + 2013.
- June performance was very weak. With -14.8% clearly below the average of the last years. With 2013 this is the only negative month at all.
- July is a mixed bag - 2 year positive performance and 2 year of negative performance. 2012 and 2013 were positive though.
- The average is positive with 2.1% but that is mainly due to the bull rund 2017. The average incl. 2012and 2013 is even more positive. That is mainly due to the 40%+ spike in 2012 so I wouldn't rely on that.
So just looking at this table we probably facing another negative month.
News about the blog
- None
Analysts key statements:
Tone (bearish):
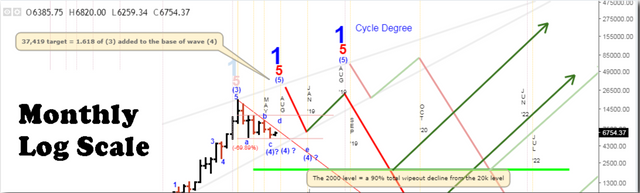
Quarterly chart: We are almost done with 1-4 correction. October / November could be the bottom.
Monthly: We are on 5 of 9 - looking for 4 month of downside. Which would bring us also to November as a bottom.
Also we never had a big reversal on this scale.
Short-term outlook:
- Weekly: Tomorrow we have a close - that he is looking for. 30 MA will go down significantly and that will be interesting to see. We broke the triangle to the downside and came back to test the bottom of the triangle.
- Daily: Red count is probably going to break which is not good as we probably going to see a reset and a start of another 9 count.
All MA moving down.
5 days in the row with beginning and close below the candles of 1 quarter of the year. That is bearish for him,
There is plenty of room to go down.
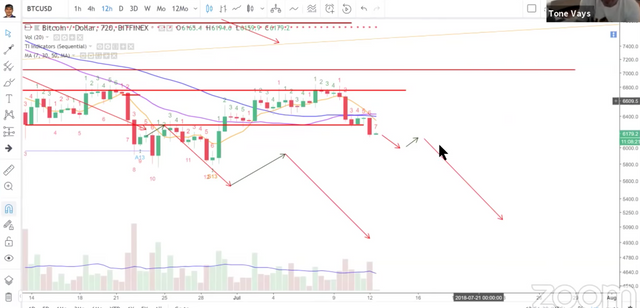
He expects the drop to 5'000 to be imminent.
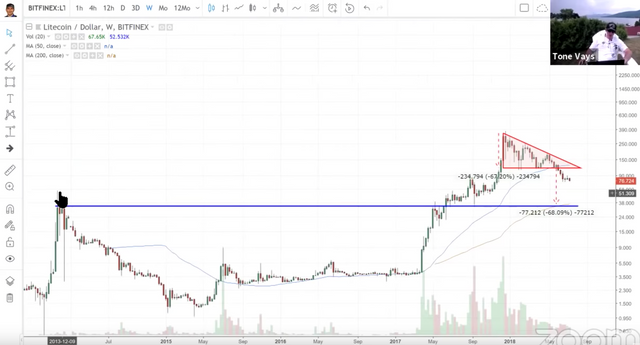
He did also an interesting comparison of bitcoin to litecoin. Litecoin formed a Tringle - very clean and had a break down of it. The target is than the hight of the triangle which leads to a target close to 35 USD. Which is exactly the high of 2014 (weekly close) and close to the MA 200 (weekly).
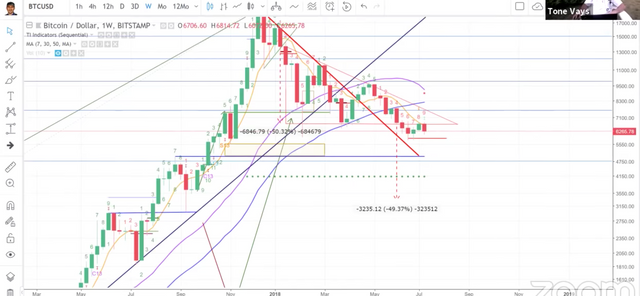
Bitcoin broke also down from a giant triangle and could move similar to it. The target for bitcoin is around 3'200.
Litecoin triangle break down:
Bitcoin triangle break down:
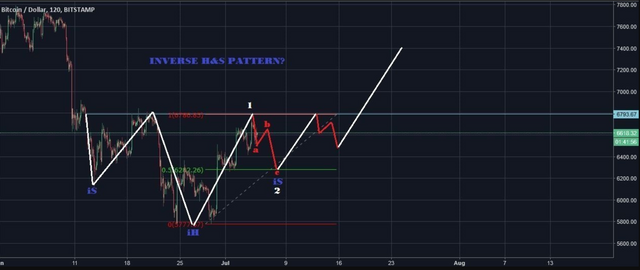
@lordoftruth (bullish):
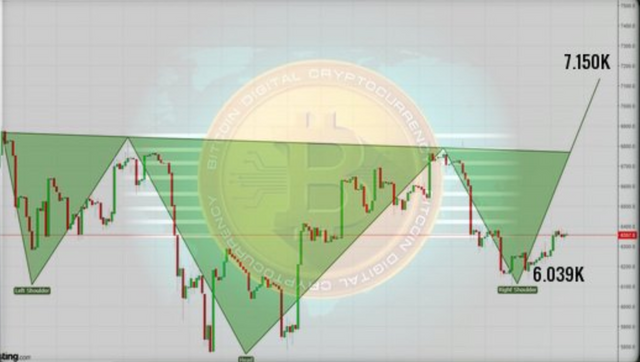
Conform 4H, there are some background for Short Term upside retracement, and Bitcoin price could support this action.
For Our Long Entry, we placed our SL at 6.039K as most likely the
price will breach 6.420K to start recovery attempts the target of 6.842K followed by 7.150K, supported by IH&S pattern shown on the below chart.
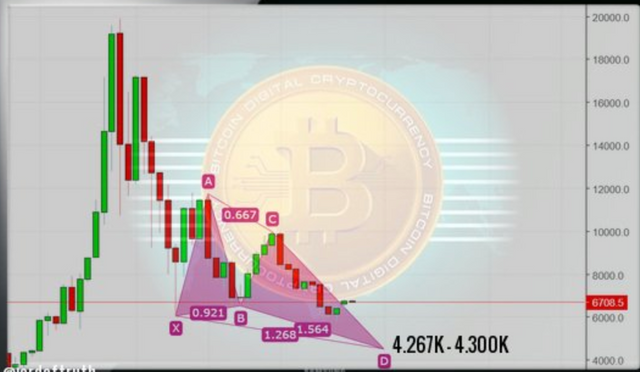
weekly
Stands the same and our major target of AB-CD Pattern around 4'300 still valid.
Todays trend is bullish. Trading between 6'039 and 6'842.
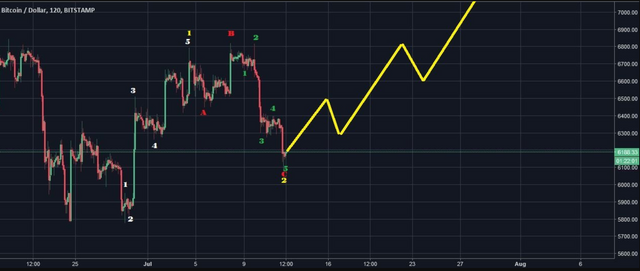
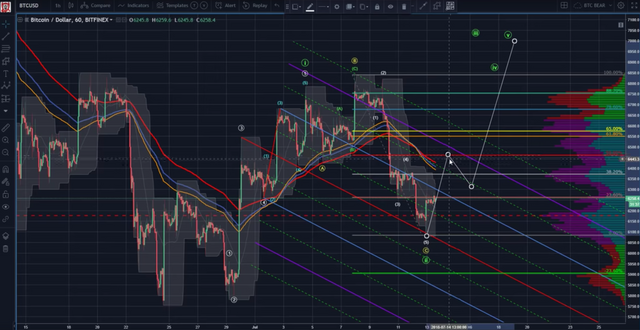
@ew-and-patterns (slightly bullish):
Update on the bull count:
I am counting white waves 1 and 2 from the 6'070 low. Also yellow subwaves 1 and 2 of white wave 3 might have formed already. If so, BTC should start the next pump very soon.
.png)
Scenario from older posts:
Bullish:
Bearish scenario: He sees a short term bounce up to 6'500 and than going down from there.
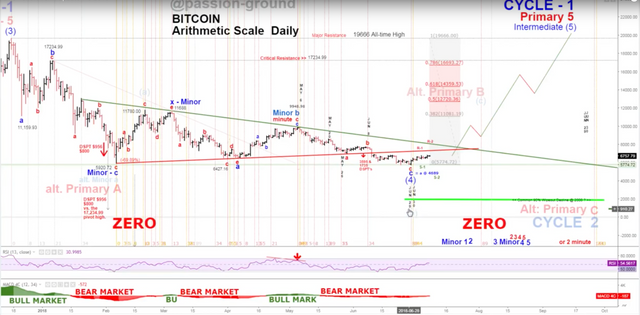
@passion-ground (neutral):

Still looking for clues as to the sustainability of the recent bear market lows. Thus far, basis the higher highs, and higher lows, we are the right track short-term.
He is still looking for clues how strong the bounce is. Higher highs and lower lows is a good start. But not yet we have broken through significant resistance levels. Next turn month is August, than January.
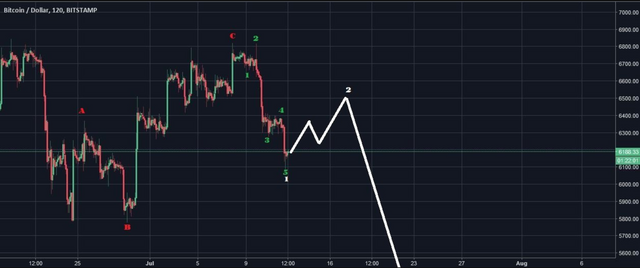
TradeDevils (bearish):
Target of 6'400 is captured.
The bearish view - primary - we go down from here to 5'900. This is based on the ew count as this being a wave 4 and now expecting wave 5 down. Also we have a fractal which almost looks identical (see picture).
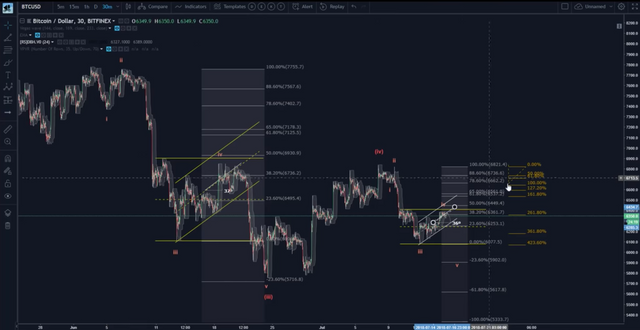
Bullish count alternate:
He sees some divergence.
We came down to the golden zone which would be the perfect spot for wave 2 and going up from here to a wave 3 with a target of 7'050.
We need to get through 6'580 to get "algo" support. Therefore we need to see some real action breaking to the upside.
Looking for 5 waves up - higher lows.
Tyler Jenks (neutral):
Short term he only positions himself if he sees a move of the market of 5% in either direction. So at the moment he is neutral but seeing us based on consensio in a bearish market (daily/weekly).
The 7 MA weekly is below the 30 MA weekly and both are declining. That is a bear market by definition for him. Also the 30 MA is accelerating to the downside making it likely to cross the 50 MA in the near future. That would be another bearish sign for him.
UglyOldGoat (bullish):
Beside all analysts who seem to lean to the downside Ugly has a different opinion. He see that fear is influencing the view - looking on the pure technicals he sees based on the TD system
- Quarterly 3 candle correction from quarterly 9
- Weekly buy signaled based on a 9
- 8 hour buy signaled based on a 9
- 4 hour buy signaled based on a 9
IT's time to pull the trigger
The basis, relative strength, the timing indicators all say it is time to pull the trigger and risk 1st and 2nd quarter lows. Yes, if we break it will be hard but that is fear. . . everything else says this is a low risk time and place to be a buyer.
Reference table
| analyst | latest content date | link to content for details |
|---|---|---|
| Tone Vays | 15. July | here |
| @lordoftruth | 16. July | here |
| @ew-and-patterns | 14. July | here |
| @passion-ground | 09. July | here |
| @tradedevil | 16. July | here |
| Tyler Jenks | 05. July | here |
| UglyOldGoat | 12. July | here |
Definition
- light blue highlighted = all content that changed since last update.
- sentiment = how in general the analysts see the current situation (bearish = lower prices more likely / bullish = higher prices more likely). The sentiment is based on 4hr, daily, weekly, monthly candle charts.
- The forecast time horizon of candles can be compared with approx. 4hr = 1-2 days; daily = 4-14 days; weekly = 4 - 14 weeks; monthly = 4 - 14 month.
- target = the next (short term) price target an analysts mentions. This might be next day or in a few days. It might be that an analyst is bullish but sees a short term pull-back so giving nevertheless a lower (short term) target.
- support/res(istance) = Most significant support or resistances mentioned by the analysts. If those are breached a significant move to the upside or downside is expected.
Educational links:
- From @ToneVays: Learning trading
- From @lordoftruth: Fibonacci Retracement
- From @philakonecrypto: Like in every post you find links to his amazing educational videos. For example here. In addition he has an online course which you can find here
- From @haejin: Elliott Wave Counting Tutorial
*If you like me to add other analysts or add information please let me know in the comments.
Still in the correction!
Very well explained.
Reading graphics and long knowledge.
Snuffles will tell you what is going to happen and that is Up. Intermediat term bottom was made and now we go higher for now. New highs? Not anytime soon.
Hey (user name) that is a great post/artwork, you have earned an upvote from me ! Did you know about the latest addition to the steem blockchain ? It’s called Artisteem and as you may have guess from the name it is focus around art, you should really check it out ! (http://www.artisteem.com/)