Bitcoin TA - summary of analysts - 16. Apr 18
Regular daily update on BTC ta analysts opinions.

My summary - short-term sentiment: bullish (last: bullish)

A short term correction is expected to the level of 7'500 - after that continuation of the bullish uptrend.
The bulls see the downtrend to be over and the 6'500 level as swing low.
Tone still remains bearish. Scaling out on weekly he sees no sign of turning bullish (yet). The similarity to 2014 is overwhelming in his point of view - the move upward might be the 2014 bull trap which destroyed the bulls for month.
April is used to be a good month for crypto. Lets see how this turns out this time.


News about the blog
I need to revise my 2018 long term table. I need to add a 2018 and 2019 target an be more precise on the sentiment here. Will do that after I am back in Switzerland.
We lunched the bounty project beta. If you are interested and you like to create a bounty on your own have a look at this post
Analysts key statements:
Tone:

- Weekly: Stays clearly bearish.
- Daily: Massive resistance is mounting - 50 MA, 200 MA which has proven as very relevant for bitcoin, fib line, log down trend and some others. He stays bearish and very sceptical of current move.
@haejin:
He is expecting bitcoin to rise further. Blue wave 3 is in the making.
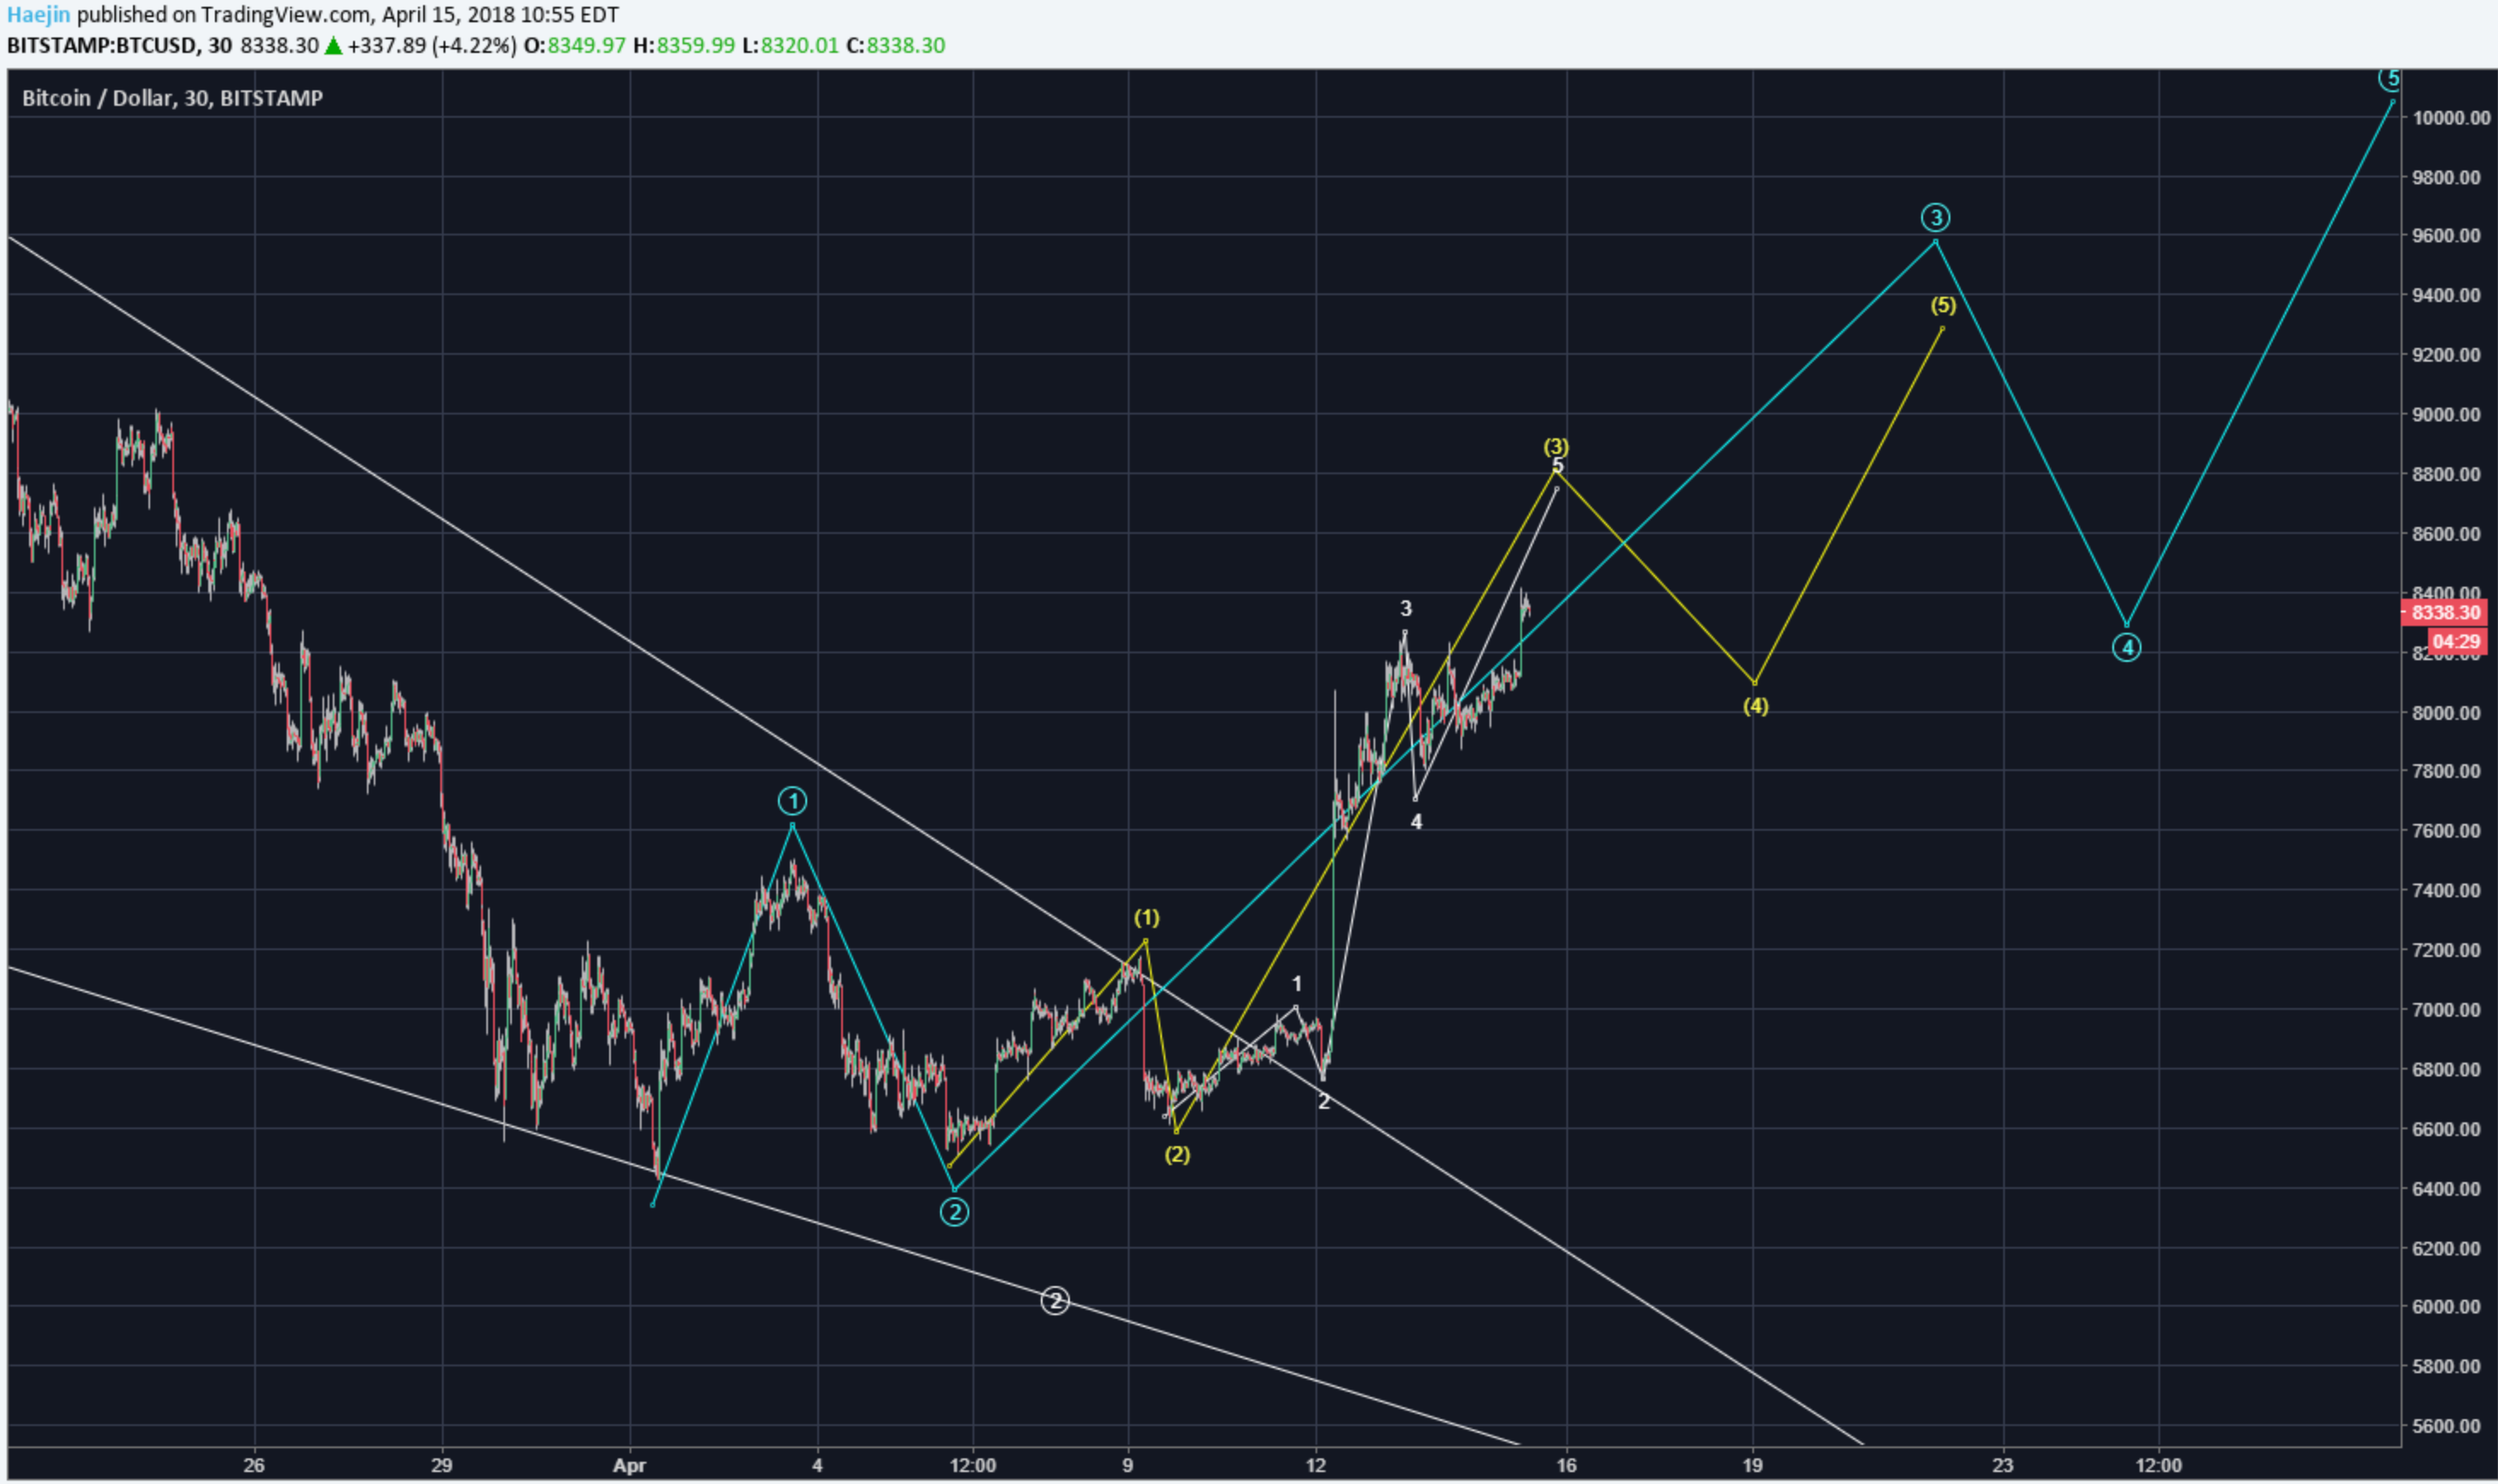
He sees a white "W" pattern in play - the bottom for this pattern is in. The downward wedge is bullish.

@ew-and-patterns:
Best case scenario brings BTC back to 14'000 in only a few weeks (6-12).

The bigger picture could look like this soon. He assumes the downtrend to be over most likely.

@lordoftruth:
Bitcoin facing monster resistance at 8'640. That needs to be cleared to retest 9'120 (swing high).
Bollinger Bands show the upper limit was exceeded. Pull back towards 7'500 seems likely. As long as we stay above 7'380 we are bullish. 6'490 seems to going to hold for the long run (most of 2018).
Todays trend is slightly bullish. Expected trading for today is between 7'500 and 8'700.
@philakonesteemit:
He believes firmly that 6'500 is the floor.
He sees two scenarios. First one is confirmed by breaking 8'240.

Second scenario we correct to 7'621 - 7'428 range first and than move up to strong resistance at 8'650.

@passion-ground:
Bitcoin remain bullish in a unsustainable short-term uptrend. He expects to drop out of it to the downside in the next view days - binging us to a showdown where we see if this current bullish momentum is sustainable or not.

Summary of targets/support/resistance


Reference table
| analyst | latest content date | link to content for details |
|---|---|---|
| Tone Vays | 13. Apr | here |
| @haejin | 15. Apr | here |
| @ew-and-patterns | 15. Apr | here |
| @lordoftruth | 16. Apr | here |
| @philakonesteemit | 15. Apr | here |
| @passion-ground | 16. Apr | here |
Definition
- light blue highlighted = all content that changed since last update.
- sentiment = how in general the analysts see the current situation (bearish = lower prices more likely / bullish = higher prices more likely)
- target = the next (short term) price target an analysts mentions. This might be next day or in a few days. It might be that an analyst is bullish but sees a short term pull-back so giving nevertheless a lower (short term) target.
- support/res(istance) = Most significant support or resistances mentioned by the analysts. If those are breached a significant move to the upside or downside is expected.
- bottom = -> now renamed and moved to long term table. Low 2018
- low/top 2018 = what is the low or the top expected for 2018?
Further links for educational purposes:
- From @ToneVays: Learning trading
- From @philakonecrypto: Like in every post you find links to his amazing educational videos. For example here
- From @lordoftruth: Fibonacci Retracement
- From @haejin: Elliott Wave Counting Tutorial
*If you like me to add other analysts or add information please let me know in the comments.
Thanks again for taking the time to consolidate all these different views on the crypto market from the different technicians. Upvoted and resteemed.
Very informative & interesting post about cryptocurrency .
Great analysis and awesome informative post..........thanks for another important information......Upvote done @famunger
Also see a floor at 6500 and a correction until about $ 6.950 in BTC, where there is my prefered buy level.
Hi friends
his post is very helpful and very helpful,
Thank you friend
regards to know and best wishes always
Great analysis. Upvoted!
Check out my steem stats (and other charts) if you're interested :)
https://steemit.com/steemit/@steemcharts/daily-steem-charts-and-stats-april-15-2018
Thx for the daily summary :) Even though I am not into Chart Analysis myself, it is interesting to see what "the experts" think about their waves!
@famunger This is good way to see what the general consensus is from other traders on Steemit in relation to BTC.