Bitcoin TA - summary of analysts - 03. July 18
Regular daily update on BTC ta analysts opinions.

**My summary - short-term (next 24h) sentiment: neutral ** (last: bearish)

Bearish scenario:
- Rebound is a dead cat bounce turning below 7'000
- Price falls below 6'000 again and quickly gravitates towards 5'500.
- Short term recovery from 5'500 staying under 6'000.
- After breaking 5'500 again a significant drop towards new lows in the range of 4'975 and 4'300.
Bull scenario:
- We get huge follow up.
- We go up to 7'500 and higher.
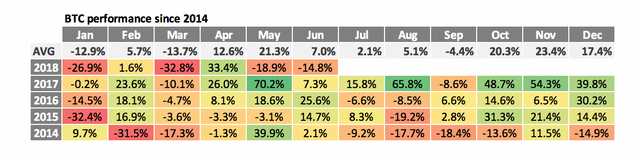
Monthly performance overview:
- Update the table and added a "average" (avg) performance.
- June performance was very weak. With -14.8% clearly below the average of the last years. In fact this year is the only negative month at all (yes - including 2014).
- July is a mixed bag - 2 year positive performance and 2 year of negative performance.
- The average is positive with 7% but that is mainly due to the bull rund 2017. So just looking at this table we probably facing another negative month.
News about the blog
- added/update monthly performance section
- updated "Educational links" section
- added a bullish and bearish scenario to my overview section
I hope you find those changes helpful.
Analysts key statements:
Tone:

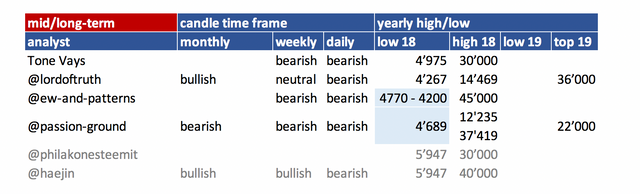
Mid-term outlook: -> unchanged
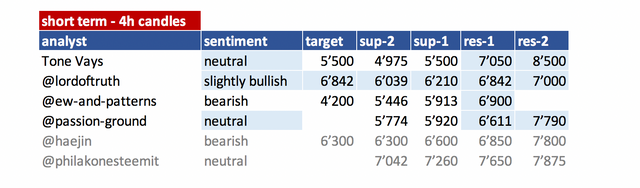
He expects us to put in a swing low at around 5'000 in first two weeks of June. From there we probably bounce strong towards 7'500 and more.
Still he is expecting that we put in a final low only at around October.
- Weekly: Lets wait for weekly close. For now he keeps his target of below 5'000 in first two weeks of July. If we see a good move up he might postpone his 5'000 target but the price target will most likely remain.
He expects this move to struggle to go over 7'050. The most he can see is to move up to the death cross of 30 and 50 MA. Probably at the time of 1 August - at a level of 8'500.
@lordoftruth:
Technical indicators showing mixed signals for now. The reason why we think, that the recent rallies are merely a dead cat bounce from the recent strong declines, as traders seeking higher returns appear to be turning towards cryptocurrencies since stocks and commodities have been vulnerable to trade rhetoric.
This week we still need to keep an eye on downside tendency as if the price do not move above 6'842, our below bearish scenario will be still valid.
Todays trend is slightly bullish. Trading between 6'210 and 6'842.
@ew-and-patterns:'
Get ready for the next drop. The expanded flat pattern will likely be done in the next 24 hours (meaning the move up ends with the high of wave C).
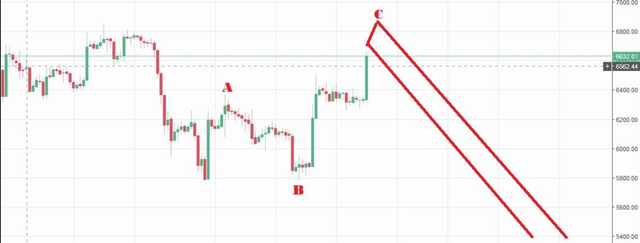
7'000 at max before the drop. I don't think it will be a big drop, but it will lead to a new low.
BTC is channeling and moving very orderly for now. IF true, there are a few waves down to come. Target still 4'200.
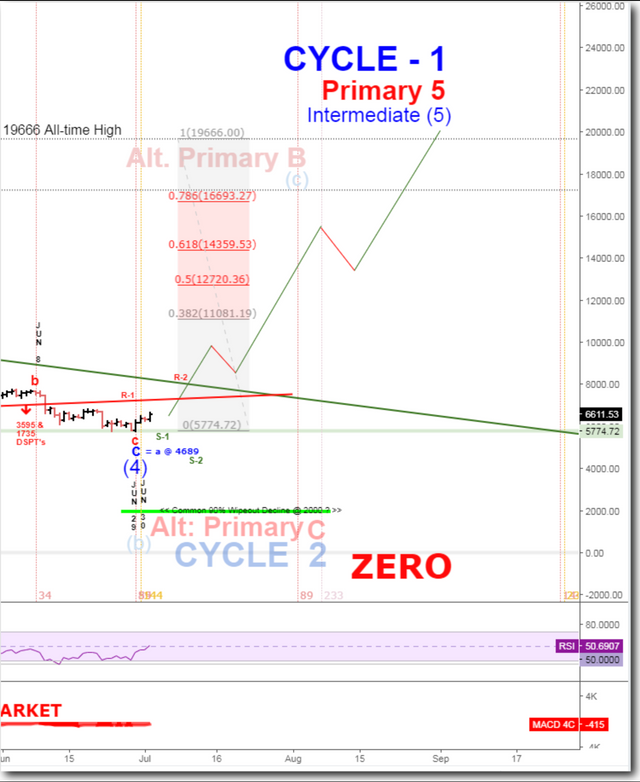
@passion-ground:
Only time will tell if a meaningful and lasting bottom is in. The monthly chart still holds out for further weakness into 2019, however, that does not diminish the nice move up we’ve had off the most recent bear market low. (See video for details)…
For bull run we need to see a much more powerful wave up to 8'366 level.
Daily doesn't look good. Positive sign we have some bullish divergence on the RSI.
The most bullish count is that the intermediate (4) is in and we are moving up.
@philakonesteemit:
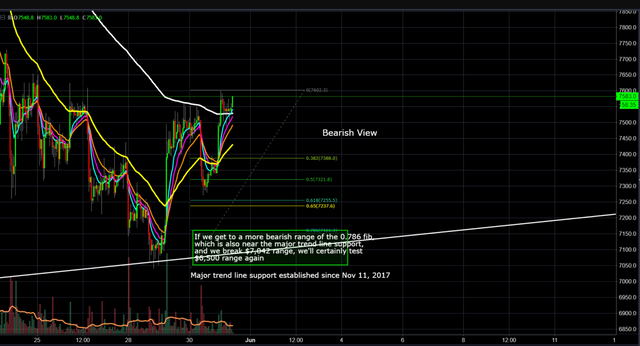
A bounce at the 7'000 level was much expected due to hitting a major trend line support established since Nov 11, 2017.
Bullish View, if we break the 7'650 range, there's a chance to hit 7'850 to 8'000 range (0.5 to 0.618 fib retracement)
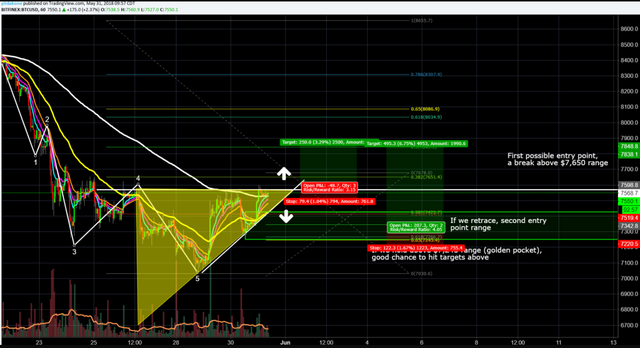
Bearish View, if we break 7'161 range, we'll most likely test 7'040, which I see as failing to hold and then testing 6'500.
@haejin:
@haejin is moving his analysis to bitcoin live. Those of you who want to follow him directly should look into subscription. I will try to get in contact to see if I can use an abstract to post here also in the future.
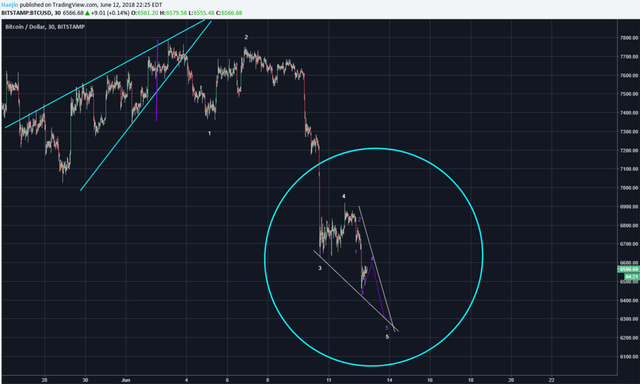
Bitcoin (BTC) Short Term Update: The blue circle shows a potential pricepathway of BTC. The purple waves have been updated and it shows a scenario where purple 1,2,3 could be complete and 4 is getting its final touches. Purple 5 is still targeting the 6'300 zone or so.
Summary of targets/support/resistance
Reference table
| analyst | latest content date | link to content for details |
|---|---|---|
| Tone Vays | 02. July | here |
| @lordoftruth | 03. July | here |
| @ew-and-patterns | 02. July | here |
| @passion-ground | 03. July | here |
| @haejin | 13. June | here |
| @philakonesteemit | 31. May | here |
Definition
- light blue highlighted = all content that changed since last update.
- sentiment = how in general the analysts see the current situation (bearish = lower prices more likely / bullish = higher prices more likely). The sentiment is based on 4hr, daily, weekly, monthly candle charts.
- target = the next (short term) price target an analysts mentions. This might be next day or in a few days. It might be that an analyst is bullish but sees a short term pull-back so giving nevertheless a lower (short term) target.
- support/res(istance) = Most significant support or resistances mentioned by the analysts. If those are breached a significant move to the upside or downside is expected.
Educational links:
- From @ToneVays: Learning trading
- From @philakonecrypto: Like in every post you find links to his amazing educational videos. For example here. In addition he has an online course which you can find here
- From @lordoftruth: Fibonacci Retracement
- From @haejin: Elliott Wave Counting Tutorial
*If you like me to add other analysts or add information please let me know in the comments.
Can you complete the "averages table" with data starting in 2012 using bitstamp data for example?
Would show a more complete big picture of the historically best performing months.
Oh yeah - that is a good idea. Will be in my today's daily.
Can anyone guess what will be the price of bitcoin in last of this month
@famunger I think the market will start to come uptrend from the last of July, but in 24 hours a lot has not been different, only 128 $ different 24 hours ,, 2018 last year, 2019 first, could be a good profit booking
Nice post
Good luck
Nice improvements, Chris!
Thanks - highly appreciated your comment especially from someone like you who is up for high quality and with very structured work.
I know I am still owning you an answer - try to do that soon.