$BTC Technical analysis: Is the Bitcoin Bear Market coming to an End?
For my first post, I thought I'd do a little bit of technical analysis on $BTC. Please remember that nothing I write here is financial advice. Furthermore, any advice on how I can improve my presentation would also be greatly appreciated.
Here, I consider the long-term trend of $BTC price over the last few months.
The $BTC downtrend started on December 17th 2017, just after a meteoric rise to $20,000. Since then, we've seen consistent downward price action, with lower lows and lower highs being set. This downward trend is illustrated by the green trend line in the image above.
We can see in the second and third red circles in the image, $BTC attempted to break this downward cycle. In the second (middle) circle, on the 7th of January, the bulls attempted to hold above $17,000 but failed. Having failed to break higher, $BTC fell to the February 6th low of $6,000 before making a renewed attempt to break the resistance on February 20th (the third red circle).
In both of the attempts to break the resistance line, $BTC was approaching the top of the Bollinger bands (the green band which encompasses the price action) and this created extra resistance which $BTC was unable to fight through. We can see in the third circle a shooting star candlestick pattern too, with a long upper wick and small body, this was a bear signal and clear indication that we were in a bull trap (that the market would continue downwards).
Just a few days ago (March 1st) $BTC breached the downward trendline at $10700 and has so far managed to hold above it since. Some commentators have noted that we may still be facing a second bull trap like the one on February 20th. I'd like to point to some evidence that potentially suggests otherwise.
Firstly, from the above image, we can see that this time, $BTC rode the middle of the Bollinger (the 20-day moving average) into the resistance line. This meant that it was not challenged by the resistance it had previously met at the top of the Bollinger, and was supported underneath by the middle Bollinger instead.
Perhaps more importantly, this was the first time that a number of significant moving averages breached the resistance line alongside $BTC.

Firstly, pay attention to the three blue arrows on this 1-hour chart. We can see that the middle Bollinger has never successfully crossed the down-trending resistance line. It came very close at the second attempt but just fell short. On our most recent attempt however the middle Bollinger successfully crossed over the trend line. We can see that there is a sustained price movement upwards the moment the middle Bollinger crossed the line.
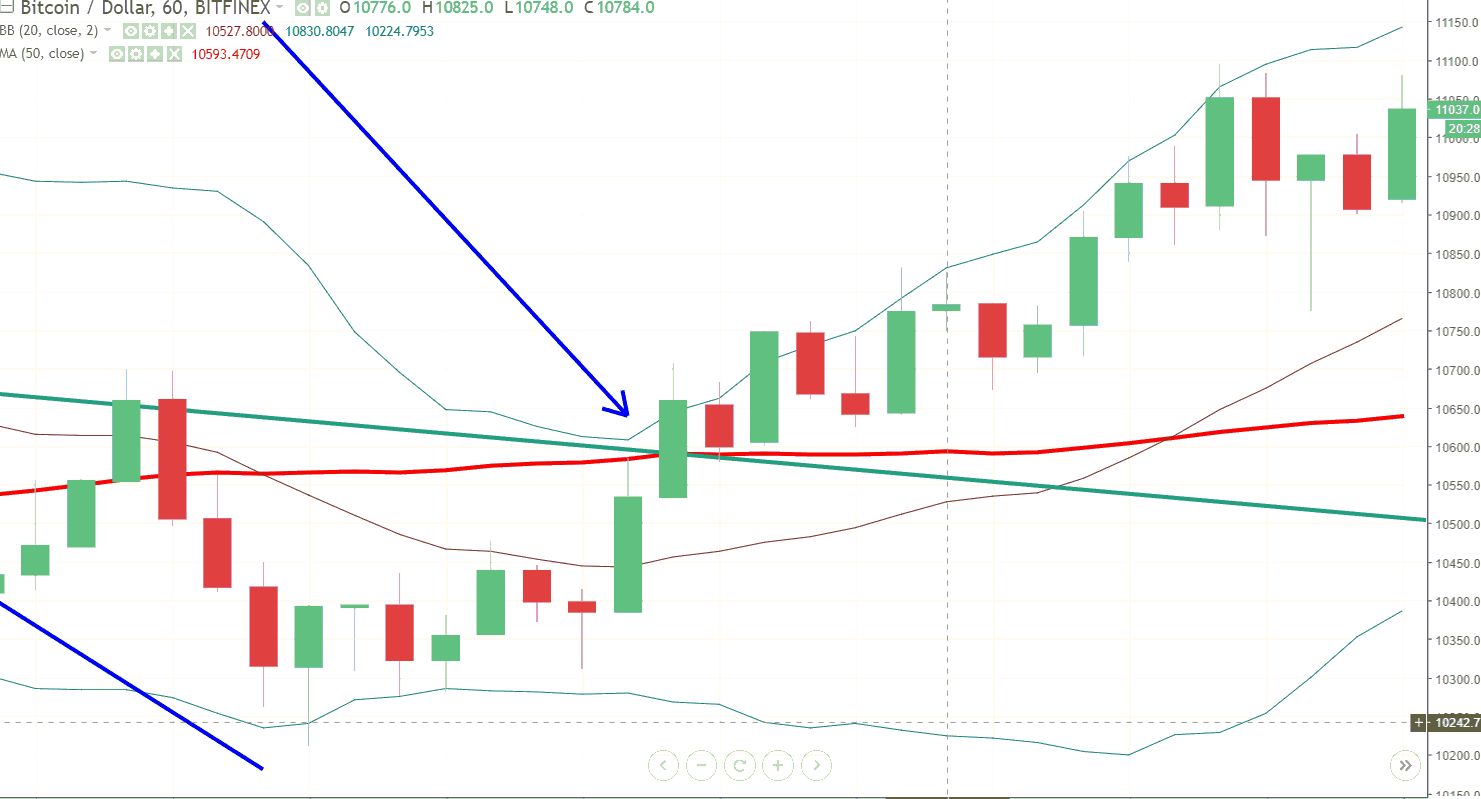
Secondly, again on the 1 hour chart, observe the red line crossing the down-trending resistance. The red line is the 50-period moving average, and we can see that as it crossed, the bulls were able to build a lot of strength moving upwards in this candle. The following candle was therefore able to find support from the 50-moving average, which helped it stay above the down-trending resistance line.
Today, on March 5th, $BTC sits at around $11,600; the down-trending resistance line is at $10,060 and will fall below $10,000 tomorrow. $BTC would now have to break through support at the 20, 50, and 1000 moving averages, as well as the psychological resistance of $10,000, to fall below the down-trending resistance line.
This indicates that the bulls may have finally breached the resistance line and $BTC could well be headed back for upward price action. We do have significant resistance up ahead, most notably: the recent high of $11,800; the psychological resistance of $12,000 and then the 50% Fibonacci line at $13,000, nonetheless, things might be starting to look up for Bitcoin at last.
Cool Post. Since you got the bitcoin tag do you have a prediction for Bitcoin over the next few days? Also followed you for future posts :)
I don't have any price predictions as the market is so volatile. As things stand right now, it looks like the current push has run out of steam as volume is down. I do still think we're moving into a bull market though, and will be watching support levels @ 10900 (200MA on 1HR charts) and @ 10600 (20MA/Middle Bollinger on 1D charts) to hold. If those levels don't collapse, then we'll probably make another move up to the resistance level @ 11300 (Fibonacci Line) after breaking through 11000 (psychological resistance).
As we speak, right now is quite critical, as we're at that 10900 level.
Congratulations @eilharte! You received a personal award!
Click here to view your Board
Do not miss the last post from @steemitboard:
Vote for @Steemitboard as a witness and get one more award and increased upvotes!
Congratulations @eilharte! You received a personal award!
You can view your badges on your Steem Board and compare to others on the Steem Ranking
Do not miss the last post from @steemitboard:
Vote for @Steemitboard as a witness to get one more award and increased upvotes!