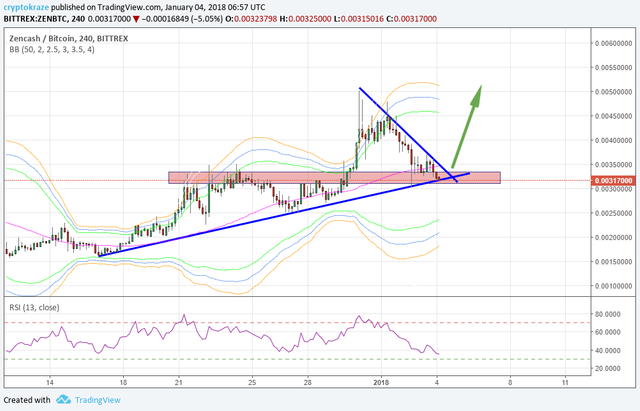
$ZenBtc Technical Analysis | Triangle Breakout Expected from this support line
CryptoKraze here
Possibility on 4 Hour Chart

If you look at 4 hour chart, you will see ZenCash has formed ascending triangle on trend line support and ready to break out of triangle. This is very common pattern in crypto currencies, whenever a coin makes this symmetrical triangle, a breakout is imminent that is right in process. If we look at RSI, it has touched 70 level and has dipped below 50 level. It has to rise up to touch 70 level again. Now let's have a look on bollinger bands, you can see price has reached median line and it will bounce from here to reach top bands again.
- I have a buy entry at 0.003250 with my profit target will be around 0.005000 or above.
- Stop loss just below the entry area is must for trading if you don't know the Averaging Technique in Crypto Trading.
Crypto Trading is risky business and you can loss partial or full amount of money. Trade at your own risk with that money only you can afford to lose. Bitcoin unexpected move will make this analysis void.


I love this post even the chart on ZEN CASH... It's really enlighten me.. I will want to know more on cryptocurrencies
Thank for sharing analisis,,
Nice post,,
I like...
Happy new year brother...
very good post and very high quality.
but what do you think about the price of steam and sbd earlier this month.
What is your opinion?
This post has received gratitude of 0.27 % from @appreciator thanks to: @cryptokraze.
Thank you @cryptokraze for promoting this post together with https://steemit.com/budget/@jerrybanfield/introducing-steem-budget-proposals