Advanced Crypto Technical Analysis with Infographics
Good day Steemers! This is the continuation of the previous content, all about crypto technical analysis. Lesss gooo! As I've noticed, Crypto exchanges have become more demand in this year due to growing interest in Bitcoin and other altcoins. One often complication aspects are cryptocurrency charts, where not only do other exchanges have bad charting functionality, but they also normally only offer these charts for coins they support. So if we use more than one exchange, to check daily prices we need to go to each individual exchange or used other charting tool. Those charting tool has no default guides on how the technical analysis in crypto works.
This content goes through advance technical analysis with info-graphics. Below are the indicators/charts that mostly used in analysis.
1. Elliott Wave Analysis
This is the form of technical analysis that cryptocurrency traders use to examin market cycles and update markets trends by identifying big boys/whales psychology, highs and low in coin prices and other collective factors. The best thing using EW analysis is to get the wave count correct. I'm using this technique believe the market moves in waves and that price action is primarily driven by groups of five waves as follows:
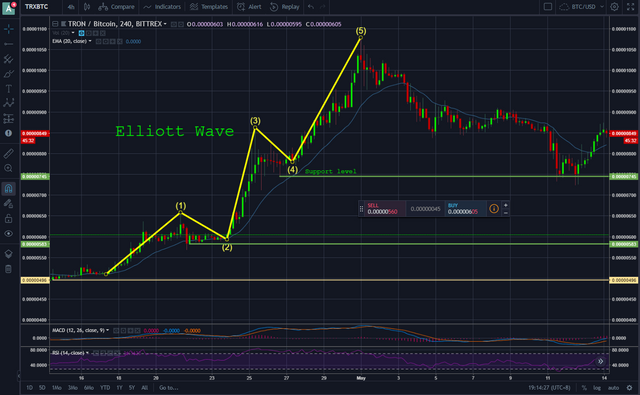
Elliott Wave traders believe that markets are affected by collective investor psychology, or people psychology, and that it moves between optimism and pessimism in natural sequences. As a friendly reminder that it takes years to master this analysis, but some cryptocurrency traders feel they have a good enough grasp of the basics to apply it to markets such as Bitcoin.
2. Fibonacci retracement
An offshoot of Elliott Wave Analysis. Simply stated, it is a way to locate possible support and resistance levels in a cryptocurrency market.
For example, after making a high/low range, traders expect a market to retrace 38.2% to 50% of this range to set up the next potential buying or selling opportunity. Both are Fibonacci levels.
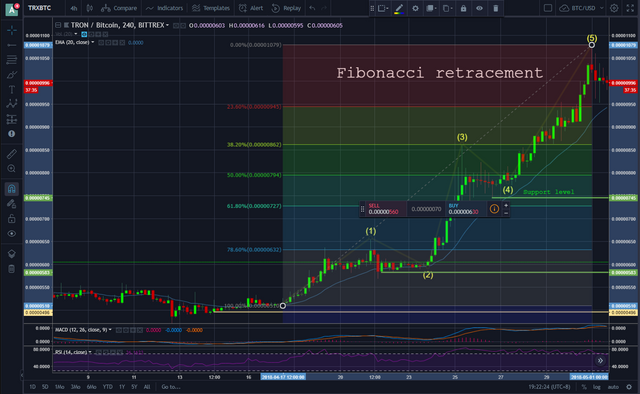
Inversely, after making a dip, for example, I will try to forecast the next rally by applying mathematics to the price action. I use Fibonacci level to estimate the trend length and trend’s corrections.
3. Stochastics and Relative Strength Index (RSI)
It was developed by J. Welles Wilder, is a momentum oscillator that measures the speed and change of price movements. The RSI oscillates between zero and 100. Traditionally the RSI is considered overbought when above 70 and oversold when below 30. I commonly use it to determine the strength of a trend or to predict tops and bottoms because of overbought and oversold conditions. As Bitcoin or other altcoins prices often trade in an overbought or oversold condition due to its high volatility, RSI indicator signals traders to enter or exit a certain position.
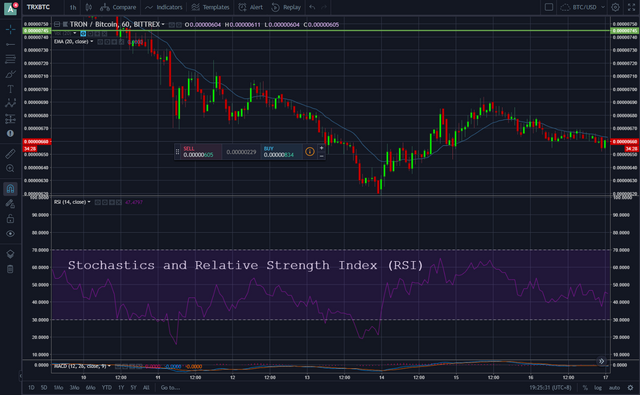
During a prolonged move down, the oscillators will near 0, indicating that a bottom may be near. During a prolonged move up, the oscillators will near 100, indicating that a top may be near. In the attached graph, Bitcoin is currently at 43.52(RSI), meaning that Bitcoin is oversold and upcoming correction is expected.
4. MACD or Moving Average Convergence/Divergence
A trend-following momentum indicator that shows the relationship between two moving averages of prices. The MACD is calculated by subtracting the 26-day exponential moving average (EMA) from the 12-day EMA that help measure momentum in a crypto currency.
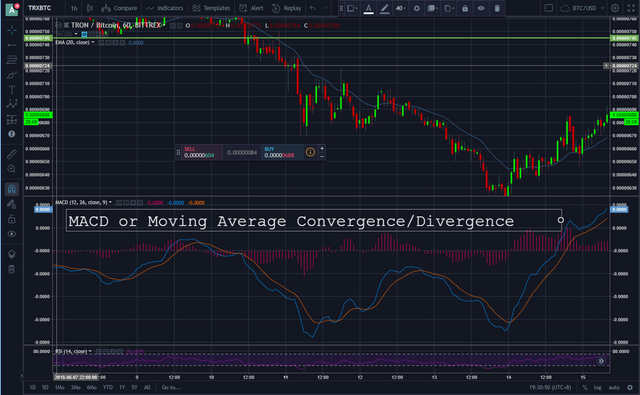
Also, MACD compares short-term momentum and long-term momentum in a crypto market to warn the current direction of momentum rather than the direction of the price.
When the MACD is positive, it signals that the crypto currency’s momentum is upward, specially the bullish divergence occur. The opposite is true when the MACD is negative (bearish divergence).
5. Ichimoku Clouds
Also known as Ichimoku Kinko Hyo, is a versatile indicator that defines support and resistance, identifies trend direction, gauges momentum and provides trading signals. Ichimoku Kinko Hyo translates into “one look equilibrium chart”. The “clouds” are formed between spans of moving averages plotted six months ahead, and the midpoint of the 52-week high and low plotted six months ahead.
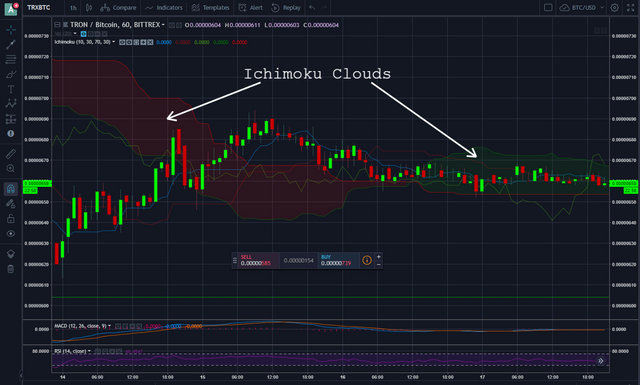
As above chart, the overall trend is up when prices are above the cloud, down when prices are below the cloud and flat when they are in the cloud itself.
6. Volume
The amount of a financial instrument that was traded over a specified period of time. It can refer to coins, shares, contracts or lots. The data is tracked and provided by crypto market exchanges. It is one of the oldest and most popular indicators and is usually plotted in colored columns, green for up volume and red for down volume, with a moving average.
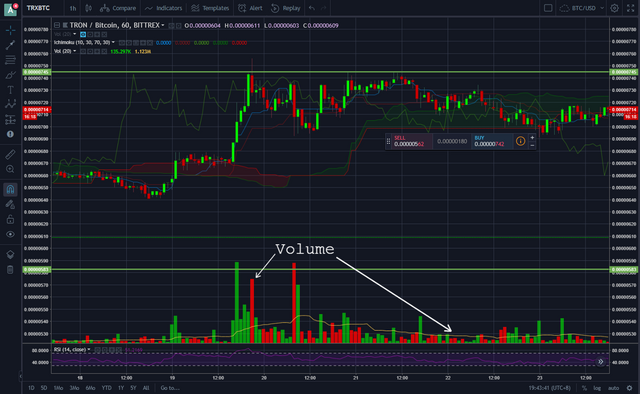
A sudden increase in trading volume points to a increased probability of the price changing. News events are typical moments when volume can increase. Strong trending moves go hand in hand with an increased trading volume.
Crypto chart/patterns
Head and Shoulders Top.
- Head and shoulders (chart pattern) On the technical analysis chart, the Head and shoulders formation occurs when a market trend is in the process of reversal either from a bullish or bearish trend; a characteristic pattern takes shape and is recognized as reversal formation. Head and Shoulders formation consists of a left shoulder, a head, and a right shoulder and a line drawn as the neckline.
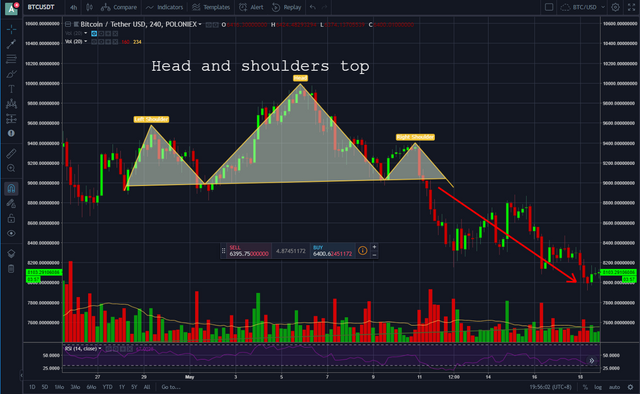
This formation is simply the inverse of a Head and Shoulders Top and often indicates a change in the trend and the sentiment. Also, the formation is upside down in which volume pattern is different from a Head and Shoulder Top. Prices move up from first low with increase volume up to a level to complete the left shoulder formation and then falls down to a new low.
Support and Resistance
- A concept that the movement of the price of a coin will tend to stop and reverse at certain predetermined price levels. These levels are denoted by multiple touches of price without a breakthrough of the level.
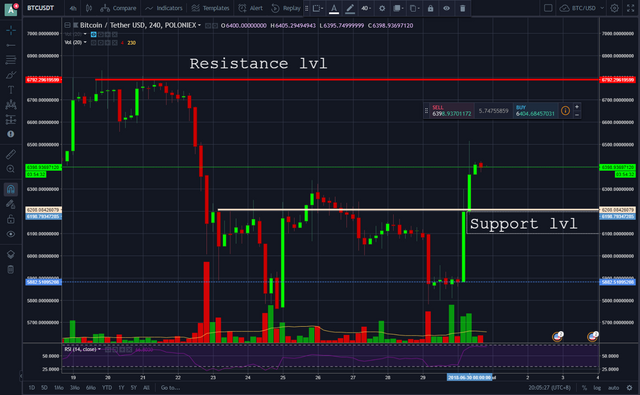
- A support level is a level where the price tends to find support as it falls. This means that the price is more likely to "bounce" off this level rather than break through it. However, once the price has breached this level, by an amount exceeding some noise, it is likely to continue falling until meeting another support level.
- A resistance level is the opposite of a support level. It is where the price tends to find resistance as it rises. Again, this means that the price is more likely to "bounce" off this level rather than break through it. However, once the price has breached this level, by an amount exceeding some noise, it is likely to continue rising until meeting another resistance level.
Ascending Triangle
- A bullish formation that usually forms during an uptrend as a continuation pattern. There are instances when ascending triangles form as reversal patterns at the end of a downtrend, but they are typically continuation patterns.
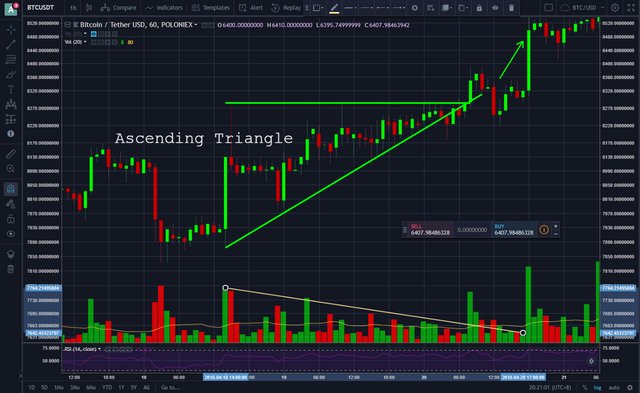
Regardless of where they form, ascending triangles are bullish patterns that indicate accumulation
Falling Wedge
- A bullish pattern that begins wide at the top and contracts as prices move lower. This price action forms a cone that slopes down as the reaction highs and reaction lows converge. In contrast to symmetrical triangles, which have no definitive slope and no bias, falling wedges definitely slope down and have a bullish bias. However, this bullish bias cannot be realized until a resistance breakout.
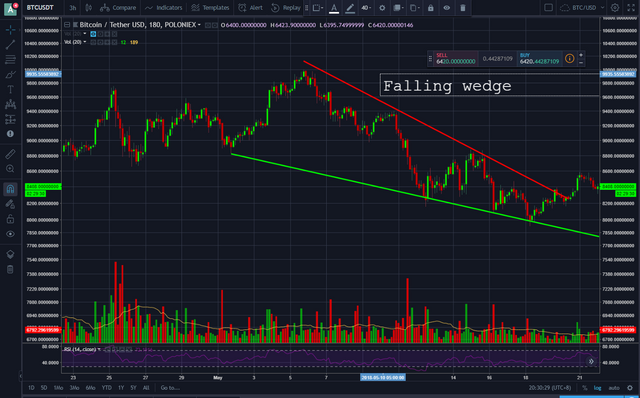
The falling wedge can also fit into the continuation category. As a continuation pattern, the falling wedge will still slope down, but the slope will be against the prevailing uptrend. As a reversal pattern, the falling wedge slopes down and with the prevailing trend. Regardless of the type (reversal or continuation), falling wedges are regarded as bullish patterns.
Bullish flag
- A formations are found in coins with strong uptrends. They are called bull flags because the pattern resembles a flag on a pole. The pole is the result of a vertical rise in a coins and the flag results from a period of consolidation.
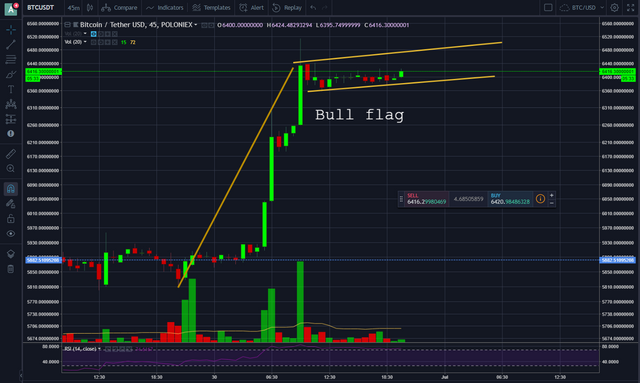
The flag can be a horizontal rectangle, but is also often angled down away from the prevailing trend.
Flag or pennant
- The sideways period, where the price drops sharply then forms the flag or pennant. With this pattern, watch for the price to break below the flag/pennant.
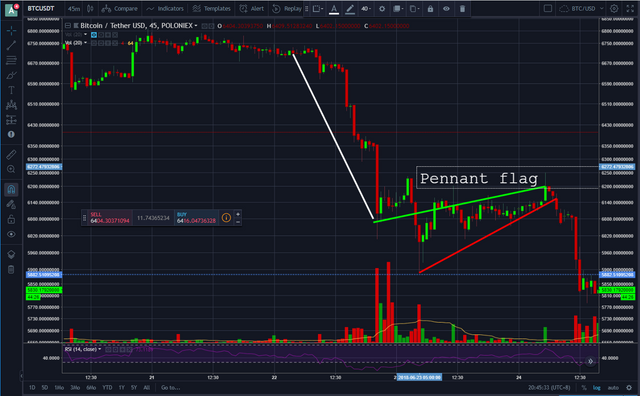
However, if a short trade is taken on the downside breakout, place a stop loss above the high of the flag/pennant (not the flag pole). Also, if a long trade is initiated on an upside breakout, place a stop loss below the low of the flag or pennant (not the flag pole).
That's it guys, hope this helps! Missed the crypto basic technical analysis? You can visit this link; https://steemit.com/cryptocurrency/@bitcoin-drin/crypto-trading-technical-analysis-with-infographics
See more Crypto related links below;
Feel free to smash subscribe/follow;
Youtube Channel: Crypto4chun
Facebook: Aldrin Rabino
Twitter: BitcoinDrin
Steemit: Crypto4chun
Post upvoted from facebook group.
Thanks! Already upvoted you :)
You have very well explained that the market is going up or down
You have very well
Explained that the market is
Going up or down
- fukrey
I'm a bot. I detect haiku.
upvote for me please? https://steemit.com/news/@bible.com/6h36cq
Congratulations @bitcoin-drin! You have completed some achievement on Steemit and have been rewarded with new badge(s) :
Click on the badge to view your Board of Honor.
If you no longer want to receive notifications, reply to this comment with the word
STOPTo support your work, I also upvoted your post!
Do not miss the last post from @steemitboard!
Participate in the SteemitBoard World Cup Contest!
Collect World Cup badges and win free SBD
Support the Gold Sponsors of the contest: @good-karma and @lukestokes