Burned tokens, rewards, and inflation summary September 17, 2022 - Total burn estimates: 96,709K STEEM/SP and 60 SBD
New visualizations added this week
Steemit launched the #burnsteem25 initiative on May 22, and the corresponding rewards started being delivered to @null on May 29. Subsequently, on August 9, Steemit announced that they'd be monitoring post promotions daily. Here is the next weekly update with PowerBI charts to visualize the burned token-related statistics since those dates.
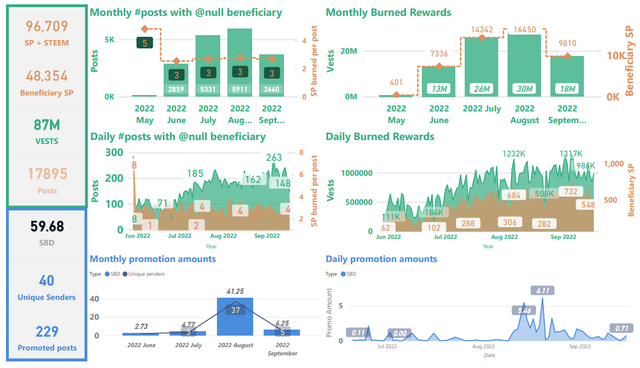
Slide 1: Burn amounts in beneficiary rewards and transfers to @null.
Weekly totals were about 7,500 STEEM/SP and 1 SBD.

Top sidebar summary cards show total number of STEEM, SP, and VESTS burned, as well as the total number of posts with @null beneficiary settings. This is where the headline number comes from.
Top-left is a new graph showing the number of posts and average SP burned per post by month.
Top-right: This shows the VESTS and the estimated SP beneficiary rewards burned per month.
Middle-left: This is a new graph showing the number of posts and average SP burned per post, by day.
Middle-right: This shows the daily VESTS and the estimated SP beneficiary rewards that have been burned.
In all three of the above charts, VESTS are shown against the left axis, SP and STEEM are shown against the right.
Bottom-left sidebar summary cards show totals for SBD burned in post promotion.
Bottom: SBD transfers to @null. As readers are likely aware, SBD transfers to @null can get a post added to the /promoted page. The visualization on the left shows the breakdown by year. The visualization in the middle shows a monthly aggregation of SBDs transferred and a count of unique senders. The visualization on the right shows the daily record.
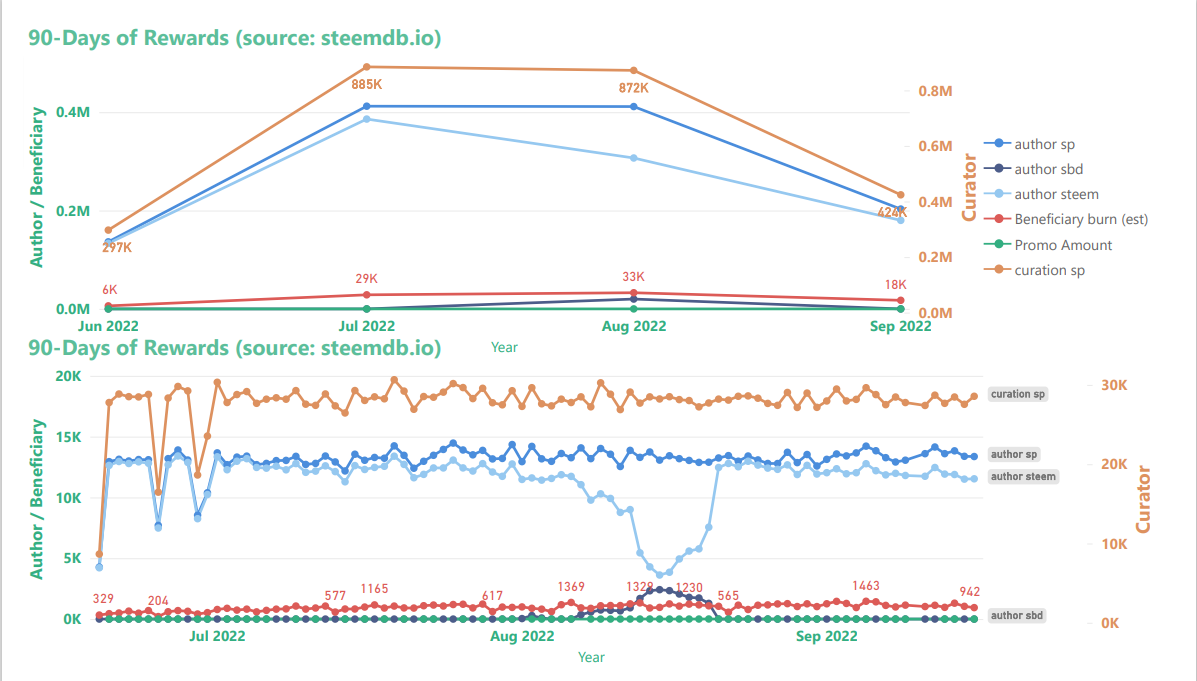
Slide 2: Rewards summary
Curator rewards use the scale on the right, author and beneficiary rewards use the scale on the left. Thus, curation rewards appear to be scaled down relative to author & beneficiary rewards. Beneficiary rewards for @null in this chart (red) have been adjusted in order to account for both SP and liquid rewards. The top graph shows the monthly aggregations, and the bottom graph shows daily totals.
Unchanged from last two weeks is that SBD printing has remained paused, due to the continuing sluggishness in the price of STEEM (and crypto markets at large). With the present SBD supply, it looks like the median on-chain price for STEEM needs to get back to about $0.252 for SBDs to start printing again.
Slide 3: STEEM & SBD Supply as well as vested (i.e. staked or "powered up") STEEM
Noteworthy this week is that the percentage of liquid STEEM has continued to decline as a percentage of both current STEEM supply and virtual STEEM supply.
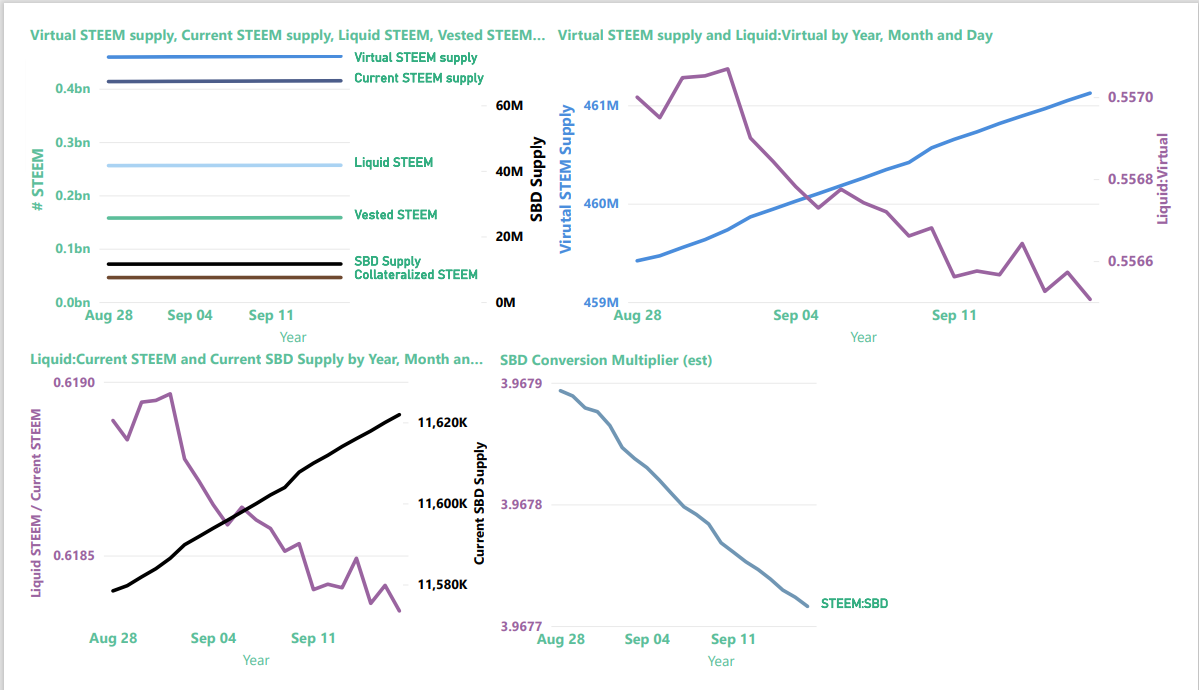
The top-left image provides a summary view of current and virtual STEEM supply, current SBD supply, liquid and vested STEEM, and the amount of STEEM reserved as collateral for paying off SBDs.
| Note |
|---|
Collateralized STEEM and current SBD supply actually represent the same value expressed in terms of STEEM or SBDs, respectively. They're aligned differently on the graph because they use different axes. |
The top-right graphic now contains a zoom-in on "virtual STEEM Supply" (left axis) and the ratio of liquid STEEM / virutal STEEM supply (right axis). As we learned, here, virtual STEEM supply is heavily influenced by price, so with STEEM prices down, it's not surprising to find the virtual STEEM supply increasing. The up-side of this is that it's now possible to burn more collateralized STEEM per SBD with post promotion.
The bottom-left visualization now contains the ratio of liquid STEEM / current STEEM supply (left axis) and a zoom-in on Current SBD supply (right axis)
The chart on the bottom right shows the value of SBDs in terms of STEEM, according to the blockchain conversion rate, not external markets. This is the inverse of the blockchain's: internal price (which is different from the actual feed median, for reasons that I don't currently understand).
Now, here are some more details about each of the values
| Parameter | Axis (left/right) | Meaning | Comments |
|---|---|---|---|
| SBD Supply | right | Number of SBDs in circulation | Equivalent in value to collateralized STEEM |
| Collateralized STEEM | left | Number of STEEM needed to pay off all SBD debt | Equivalent in value to SBD Supply |
| Vested STEEM | left | Number of STEEM staked as STEEMPOWER | |
| Liquid STEEM | left | Number of STEEM that's not staked or needed for SBD collateral | Calculated as (Current STEEM supply - Vested STEEM) |
| Current STEEM supply | left | Number of STEEM in circulation | |
| Virtual STEEM supply | left | Number of STEEM in existence |
Thanks for reading!
For previous updates, see:
- Burned tokens, rewards, and inflation summary September 10, 2022 - Total burn estimates: 88,781K STEEM/SP and 55 SBD
- Burned tokens, rewards, and inflation summary September 3, 2022 - Total burn estimates: 80,692K STEEM/SP and 54 SBD
- Burned tokens, rewards, and inflation summary August 27, 2022 - Total burn estimates: 71,850K STEEM/SP and 49 SBD
- Burned tokens, rewards, and inflation summary August 20, 2022 - Total burn estimates: 64,876K STEEM/SP and 37 SBD
- Burned tokens, rewards, and inflation summary August 13, 2022 - Estimated beneficiary burn since May 29: 56,855 STEEM
- Burned tokens, rewards, and inflation summary August 6, 2022 - Estimated beneficiary burn since May 29: 49,365 STEEM
- Burned tokens, rewards, and inflation summary July 30, 2022 - Estimated beneficiary burn since May 29: 42,556 STEEM
- Burned tokens, rewards, and inflation summary July 23, 2022 - Estimated beneficiary burn since May 29: 35,497 STEEM
- Burned tokens, rewards, and inflation summary July 16, 2022 - Estimated beneficiary burn since May 29: 28,408 STEEM
- Burned tokens, rewards, and inflation summary July 9, 2022 - Estimated beneficiary burn since May 29: 22,185 STEEM
- Burned tokens, rewards, and inflation summary July 2, 2022 - Estimated beneficiary burn since May 29: 15,312 STEEM
- Burned tokens, rewards, and inflation summary June 25, 2022 - Estimated beneficiary burn since May 29: 12,412 STEEM
- Burned tokens, rewards, and inflation summary June 18, 2022 - Estimated beneficiary burn since May 29: 8,994 STEEM
- Burned tokens, rewards, and inflation summary June 11, 2022 - Estimated beneficiary burn since May 29: 6,492 STEEM
Pixabay license, source
Reminder
Visit the /promoted page and #burnsteem25 to support the inflation-fighters who are helping to enable decentralized regulation of Steem token supply growth.
Cool new visualization. I really like. May I ask what you used to make it?
Thanks! It's done with Power BI.
It's a shame that the visualizations lose a lot of resolution when I upload them as images to Steemit's web site. It looks a lot better in the original format. I'm thinking I might also start posting weekly PDFs in github, ipfs, or btfs since the PDF format is so much more readable. Unfortunately, I don't have time to do that for this week, though.
Good idea! I have to keep bending my eyes to read the small numbers.... ;-)
An intermediate solution might be if you insert the graphics with a link to the graphic, then you can display the graphic itself larger...
like this:
Plain text:
Good idea, though I've always done it like this:
i.e.
I hadn't done that because I normally just right-click and then open the image in a new tab, but from your example, I see that the readability is much better this way, so I just updated all three images in this week's post.
That is also a possibility. I haven't been able to do that with Markdown yet. Thanks for the tip!
Sometimes I also open the image with a right-click. But often the image is still quite small and I have to resize it manually in the address. That's why I prefer one click. :-))
Agreed, and it gets blurred when you expand the size. The images definitely look much sharper this way. I hadn't been aware of that difference before.
Projecting forward it is looking like the Monthly Burned Rewards will be around 17,300 SP for September. If this comes out so it will be the highest monthly total so far since the current burning campaign began.
That would be pushing towards a 200K SP annual total.
I wonder where this comes on the price impact scale?
I would wish for it, but so far I unfortunately don't have the impression that it has any noticeable effect at all.
From the 2nd graph above, the total new rewards per day are about 58K (down from about 60 or 62K when I started this tracking - I presume due to declining inflation). At the same time, we're burning about 1K per day, 1.7% - and that doesn't even count rewards that go to witnesses or SPS.
From June through September, we've burned nearly 100K, so if you extrapolate that for a year, 300K per year is even plausible. But, with current_supply at 400 million, that's still less than 1/10% of the supply.
To be fair, though, STEEM has advanced by 10 or 20% against BTC and most of the comparison tokens that I'm tracking. Also, I haven't seen any real evidence that power-up behavior drives the price. It feels like the opposite and prices drive powerup/powerdown.
So all that is to say that I agree that the effect so far is limited. Looking at the big picture, what we're burning is still pretty small. In the end, I think he key is still the same as it was when we started talking about this. Burning tokens has to be an audience-building lever before it can become a price lever. I still think we can accomplish this, but it's not an overnight thing. There's a long way to go.
@cc: @pennsif
Yes, the burning is likely more of a community signal, than an actual price mover.
Buy demand will always be the only true market mover. Hungry-Griffin is pushing on that lever today.
I guess there is a big pile of STEEM on the exchanges to be soaked up before the price starts to move up appreciably. Although there was a bit of a price spike a few hours ago.
Right, I always forget about that. STEEM is still comparatively well placed.
Yes, compared to the current_supply, the amounts are really small, so the effect can only be seen in the long term. We will observe it...
Indeed, visualization has become much better! You've done a great job. A lot of coins were burned, which pleases. More coins are being burned every week.
At first thank you for your great information about burning tokes which will help steem a lot from many aspects. You are just like a weekly magazine to report this issue regularly. Good work.
This burning project should run long and more widely to help steem more. Steem is king.
This post has been featured in the latest edition of Steem News...
I think that the most important thing here is the repercussion that all this has, waiting for the price to stop fluctuating is almost like waiting for climate change to never appear
I hope that soon the price of steem will grow and sbd printing will start again. I think if bitcoin sharply rises in price, then steem will reach for it. After all, the price of steem in relation to bitcoin has not fallen. your visualization has really become much better! thanks for the detailed analysis.
There is a significant increase compared to last week. This made me very happy. 100k steeme is very little left. The burning mechanism should be applied to different areas.
Your post is manually rewarded by the
World of Xpilar Community Curation Trail
STEEM AUTO OPERATED AND MAINTAINED BY XPILAR TEAM
https://steemit.com/~witnesses vote xpilar.witness
Burning steem project is one of the wisest action from authority in near time. It appears they are now trying to boost up steem and steemit. Good initiatives.