Burned tokens, rewards, and inflation summary August 20, 2022 - Total burn estimates: 64,876K STEEM/SP and 37 SBD
Steemit launched the #burnsteem25 initiative on May 22, and the corresponding rewards started being delivered to @null on May 29. Subsequently, on August 9, Steemit announced that they'd be monitoring post promotions daily. Here is the next weekly update with PowerBI charts to visualize the burned token-related statistics since those dates.
Slide 1: Burn amounts in beneficiary rewards and transfers to @null.
There were no new daily highs this week, but the 663 STEEM burned last Sunday (August 13) was the second highest on record. Today's total is 366 SP, with about 7 hours left in the day. Roughly 7,300 SP and 17 SBD were burned throughout the week. This week, I added a third graph for SBD transfers to @null, visualizations now include aggregations by the year, month, and day.
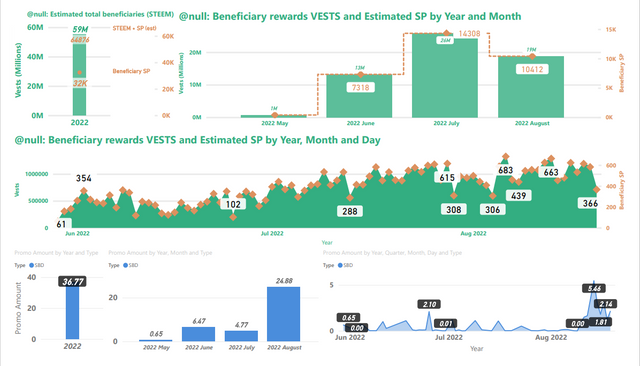
Top-left: This image shows the number of VESTS along with the estimated numbers of SP and ( SP + STEEM ) beneficiary rewards that have been burned since May 29. This is where the headline number comes from.
Top-right: This shows the VESTS and the estimated SP beneficiary rewards burned per month.
Middle: This shows the daily VESTS and the estimated SP beneficiary rewards that have been burned.
In all three of the above charts, VESTS are shown against the left axis, SP and STEEM are shown against the right.
Bottom: SBD transfers to @null. As readers are likely aware, SBD transfers to @null can get a post added to the /promoted page. The visualization on the left shows the breakdown by year. The visualization in the middle shows a monthly aggregation. The one on the right shows the daily record.
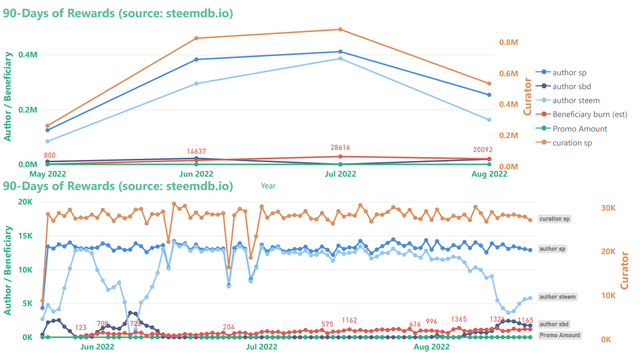
Slide 2: Rewards summary
Curator rewards use the scale on the right, author and beneficiary rewards use the scale on the left. Thus, curation rewards appear to be scaled down relative to author & beneficiary rewards. Beneficiary rewards for @null in this chart (red) have been adjusted in order to account for both SP and liquid rewards. The top graph shows the monthly aggregations, and the bottom graph shows daily totals.
Noteworthy this week is that SBD printing has continued, which we can see in the decline of STEEM going to authors and also in the increase in SBDs. At current prices, SBD printing may pause again within the next couple of days.
Slide 3: STEEM & SBD Supply as well as vested (i.e. staked or "powered up") STEEM
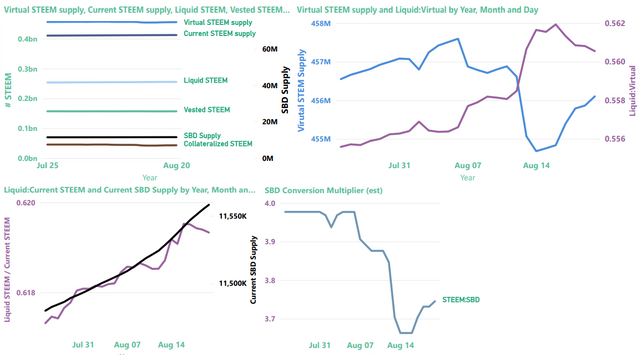
The top-left image provides a summary view of current and virtual STEEM supply, current SBD supply, liquid and vested STEEM, and the amount of STEEM reserved as collateral for paying off SBDs.
| Note |
|---|
Collateralized STEEM and current SBD supply actually represent the same value expressed in terms of STEEM or SBDs, respectively. They're aligned differently on the graph because they use different axes. |
The top-right graphic now contains a zoom-in on "virtual STEEM Supply" (left axis) and the ratio of liquid STEEM / virutal STEEM supply (right axis). As we learned, here, virtual STEEM supply is heavily influenced by price, so with STEEM prices down, it's not surprising to find the virtual STEEM supply increasing. The up-side of this is that it's now possible to burn more collateralized STEEM per SBD with post promotion.
The bottom-left visualization now contains the ratio of liquid STEEM / current STEEM supply (left axis) and a zoom-in on Current SBD supply (right axis)
The chart on the bottom right shows the value of SBDs in terms of STEEM, according to the blockchain conversion rate, not external markets. This is the inverse of the blockchain's: internal price (which is different from the actual feed median, for reasons that I don't currently understand).
Now, here are some more details about each of the values
| Parameter | Axis (left/right) | Meaning | Comments |
|---|---|---|---|
| SBD Supply | right | Number of SBDs in circulation | Equivalent in value to collateralized STEEM |
| Collateralized STEEM | left | Number of STEEM needed to pay off all SBD debt | Equivalent in value to SBD Supply |
| Vested STEEM | left | Number of STEEM staked as STEEMPOWER | |
| Liquid STEEM | left | Number of STEEM that's not staked or needed for SBD collateral | Calculated as (Current STEEM supply - Vested STEEM) |
| Current STEEM supply | left | Number of STEEM in circulation | |
| Virtual STEEM supply | left | Number of STEEM in existence |
Thanks for reading!
For previous updates, see:
- Burned tokens, rewards, and inflation summary August 13, 2022 - Estimated beneficiary burn since May 29: 56,855 STEEM
- Burned tokens, rewards, and inflation summary August 6, 2022 - Estimated beneficiary burn since May 29: 49,365 STEEM
- Burned tokens, rewards, and inflation summary July 30, 2022 - Estimated beneficiary burn since May 29: 42,556 STEEM
- Burned tokens, rewards, and inflation summary July 23, 2022 - Estimated beneficiary burn since May 29: 35,497 STEEM
- Burned tokens, rewards, and inflation summary July 16, 2022 - Estimated beneficiary burn since May 29: 28,408 STEEM
- Burned tokens, rewards, and inflation summary July 9, 2022 - Estimated beneficiary burn since May 29: 22,185 STEEM
- Burned tokens, rewards, and inflation summary July 2, 2022 - Estimated beneficiary burn since May 29: 15,312 STEEM
- Burned tokens, rewards, and inflation summary June 25, 2022 - Estimated beneficiary burn since May 29: 12,412 STEEM
- Burned tokens, rewards, and inflation summary June 18, 2022 - Estimated beneficiary burn since May 29: 8,994 STEEM
- Burned tokens, rewards, and inflation summary June 11, 2022 - Estimated beneficiary burn since May 29: 6,492 STEEM
Pixabay license, source
Reminder
Visit the /promoted page and #burnsteem25 to support the inflation-fighters who are helping to enable decentralized regulation of Steem token supply growth.
As we are only two thirds through the month it looks like August will top July for total @null beneficiaries unless there is a drop off in the coming days.
I wonder for how many months the growth can continue?
Is there any easy way to know how many different accounts are using #burnsteem25? It would be interesting to know if more people are using it.
I think you agree that there is a difference between using the tag and whether someone actually sends rewards to @null.
So there should be a better evaluation of which accounts are sending beneficiaries to @null. This is possible: :-))
For @null transfers, here is a PowerBI visualization of unique accounts (per day) with @null transfers logged in steemdb.io here.
Visualizing a count off the authors who are using beneficiary settings will take longer. I'll see if I can add it in a future report, but it probably won't be ready this week.
This comment has been featured in the latest edition of Steem News...
The burning of 67k steem is remarkable. Must be at least 100k by the end of the year
#burnsteem is a good steps to do the best with steem. You have described it very well. My thanks go to you. Is this burning project is personal or official?
This post has been featured in the latest edition of Steem News...
As the mining rate of social coin usually very high so it has a difficult way to hold its price. And for this, burning the coin to control the supply is very wise actions.
It is interesting to see the increase, ideally it should continue like this