{Steemit Crypto Academy - Season 2, Week 8} The Wyckoff Method - El Método Wyckoff

CryptoAcademy Season 2 - Week 8
The Wyckoff Method
Main guidelines for this lecture:
- The Wyckoff method: Theory and fundamental laws
- "Composite Man" and Phases
- Steps to apply this method

The Wyckoff Method
The Wyckoff method is another tool that technical analysis offers us. This particular method that we will be discussing today has been developed by Richard Demille Wyckoff, who was very well known in the 1920's for his deep understanding and analysis on the stock market.
This method presents the idea that prices can be predicted and anticipated through analyzing data related to volumes, price action and time, which will lead to understanding the supply and demand we're facing in that particular asset. He got to the conclution that the best time to place long orders is when we're about to reach the end of the accumulation area and the price is about to be marked up. On the other side, the best moment to place short orders is when we notice that supply is becoming greater than demand.
One of the main ideas of this method is to improve market timing when placing an order or thinking about entering into certain asset.
Fundamental Laws
This method is based on three fundamental laws:
Price direction is determined by supply and demand
As we have said before, supply and demand play an important role when it comes to price determination. It's no difficult concept if you think about it: if there's a higher demand volume, prices will rise; if supply's higher, prices will fall. This should be applied to the chart by checking volume and price bars over time, this will allow us to have a different insight on the market's cycle.
Cause and Effect
This law is related to the previous one, as it states that nothing in the market happens for no reason and that this comes as a consequence of a specific event that creates a preparation period. There are two types of preparation periods:
a) accumulation -which is the cause- leads to a markup/rise in the price -which is the effect-
b) distribution -which is the cause- leads to a markdown/fall in the price -which is the effect-
Law of effort vs Result
Effort is all about the volume that the asset has. If there'a connection between the volume and the price action, then we can be sure that the trend is likely to go on its course. If we get to see that this connection doesn't exist or there are significant changes regarding volume and price, then that's a clear sign that the trend might suffer a change.
Remember this, so as to identify it easily:
- High volume = big effort
- Low volume/sideways movements in the chart = small effort
"Composite Man"
One of the main things that this method has, is that it recognized the idea of a composite man. What's a Composite Man, you might be wondering? It's just an imaginary representation of the market, that's supposed to help us understand in a simpler way how the different movements are impacting and affecting the fluctuation of prices. In this way, and from now and on, we will think of the market as if it was controlled by one single identity, instead of a group of huge investors and other institutions.
From all the data and analysis that Wyckoff did, we know that:
Composite Man will try to get the rest of the investors to buy that same asset that he has been accumulating at a lower price
If we understand the behaviour of this Composite Man, we can for sure foresee and predict the prices and movements of assets, as he believe that his behaviour was predicable, as long as this method was practiced regularly and very-well understood.
We're supposed to analyze the market and charts with the purpose of understanding the behaviour of this composite man and the reasons behind his actions.
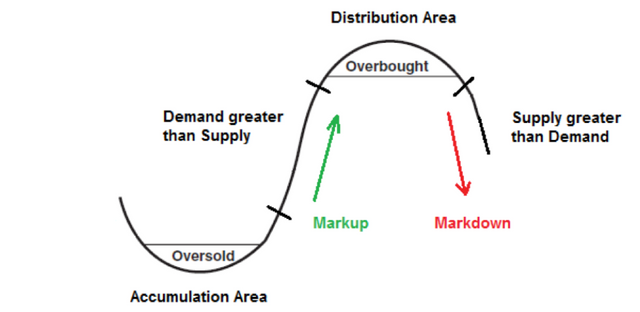
Phases
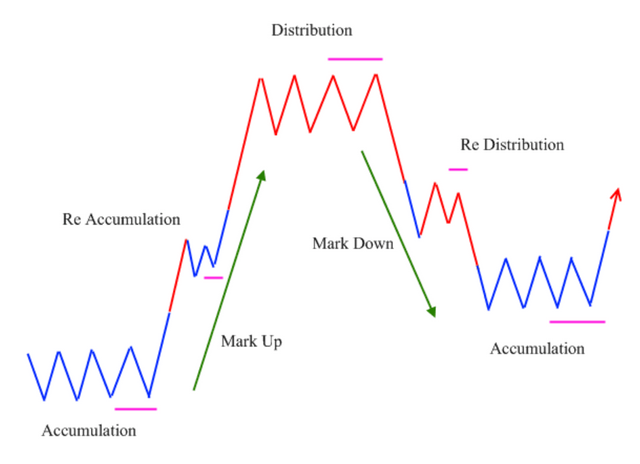
There's a cycle of four phases that this Composite Man performs, we can see the different moments in the chart above.
Accumulation: There's no much variation in the price and volume, so the chart goes sideways. Here, the Composite Man accumulates assets before the rest of the investors get in.
Markup/Uptrend: Once the accumulation is over and the supply gets scarse, the Composite Man will try to make the price go up. As there's more volume and movement regarding that asset, the price rise will probably attract other investors as well. In the chart, we will clearly see that demand gets a lot higher than supply. It can happen that, during a markup period, there's some other re-accumulation phase.
Distribution: Once again, the chart will show sideways movements, as the Composite Man will start selling his position very slowly till the demand gets completelly absorbed. The price has reached its peak and there are just a bunch of last-time buyers getting into the asset.
Downtrend/Markdown: Once the Composite Man has sold part of his assets, he will try to push the market and the price down again. At this point, the supply will be much greater than the demand, as the rest of the investors will try to sell their positions as well, as the price will get extremelly bearish.
Steps to apply this method
As we have seen, there are many things to pay attention to when applying this method. It is somehow difficult at first, till you understand how it works.
1. Examine the market
At first, it's important that you gather as much information as you can about the market. What should you look for?
Trend: Define if what you see if the market's currently bearish or bullish. Check where the volumes are going, is it a moment in which there's more supply than demand? Is it a moment in which there's more demand than supply? Is the market just going sideways?
The chosen asset: Determine how strong and how much volume it has had, as well as that, you should also be aware if it's going with the main trend of the market or if it's going against it. You should always go for assets that go with the market's trend.
2. Analyze your chart
Once you have gathered as much data as you could, it's time for you to check your assets chart. In which moment is it? What does the volume tell you?
3. Compare your asset
In cryptocurrencies it might be hard to do this, but it's always good to check your trends against some other asset, for instance BTC.
Example
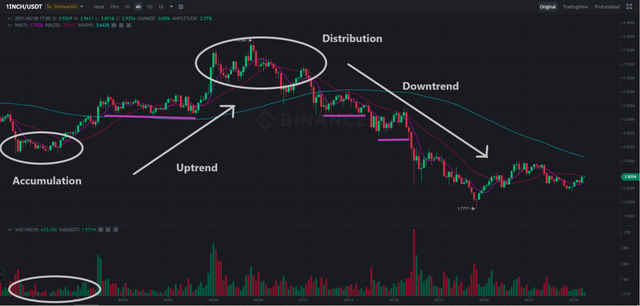
This is a INCH/USDT chart, with a 4H timeframe. In this chart, I've marked all phases of the Wyckoff cycle.
Accumulation: You see clearly that the price goes sideways and that there's no much volume or movement going on. Price is quite stable and it's clear that the cycle has just begun.
Uptrend: although it's not a huge uptrend that the asset has done, specially because the market's not in a bullish mood, the price has increased and the volume has gone up. There was also one re-accumulation phase before reaching it's peak.
Distribution: Volume increases again, but the price has reached it's peak. Many investors start selling.
Downtrend: Price falls and there was also two re-distribution phase, as you can see that it's been underlined.
Homework for this lecture:
Share your understanding on "Composite Man" and the fundamental laws. What's your point of view on them?
Share a chart of any cryptocurrency of your choice (BTC or ETH won't be taken into account for this work) and analyze it by applying this method. Show clearly the different phases, how the volume changes and give detail of what you're seeing.
Guidelines for this lecture
- Your article should be at least 300 words. Be creative and give us quality content.
- Plagiarism won't be tolerated. Don't rush to submit your task and be very detail oriented.
- Tasks will be accepted till 23.59hs June 5th 2021 - UTC Time
- Don't forget to include the following tags #fendit-s2week8 and #cryptoacademy among the first five tags you include.
- Remember that you won't be eligible for a vote if your reputation's not over 50 and you don't have 150 SP.
{Traducción al español}

CryptoAcademy Temporada 2 - Semana 8
El método Wyckoff
Puntos a tratar en esta clase:
- El método Wyckoff: Teoría y leyes fundamentales
- "Hombre Compuesto" y sus fases
- Pasos para aplicar este método
El Método Wyckoff
El método Wyckoff es otra de las herramientas que podemos encontrar dentro del análisis técnico. Este método en particular del que hablaremos fue desarrollado por Richard Demille Wyckoff, quien era bastante reconocido en la década de 1920 por su análisis profundo del mercado y su entendimiento integral del mismo.
Este método presenta la idea que los precios pueden predecirse y anticiparse a través del análisis de información relacionada al mercado, como los precios, el volumen y el tiempo, lo cual da un entendimiento valioso acerca de la oferta y la demanda que cierto activo tiene. Wyckoff llegó a la conclusión que el mejor momento para poner una orden a largo plazo es cuando se está por llegar al fin del periodo de acumulación y el precio se encuentra próximo a subir. Por otro lado, un buen momento para ingresar órdenes que queremos ejecutar en el corto plazo es cuando notamos que la oferta es bastante superior a la demanda.
Una de las principales ideas que presenta este método es la de querer mejorar el momento en el que ejecutamos una orden al ingresar en un determinado activo.
Leyes fundamentales
Este método se basa en tres leyes fundamentales:
La dirección del precio está determinada por la oferta y la demanda
Como ya dijimos, la oferta y la demanda son uno de los ejes vitales cuando se habla de la determinación del percio. No es un concepto difícil si lo piensas: si hay un mayor volumen de demanda, los precios subirán, ya que todos querrán hacerse de ese activo escaso; por otro lado, si la oferta es superior, el precio caerá, debido a que los vendedores del activo serán en cantidad superiores a los compradores. Esto debe aplicarse al gráfico cuando chequeamos las barras de precio y volumen en el transcurso del tiempo, lo cual nos permitirá saber en qué ciclo del mercado nos ubicamos.
Causa y Efecto
Esta ley está relacionada a la anterior, ya que establece que nada en el mercado ocurre sin razón aparente y que todo movimiento es consecuencia de un evento en específico, lo cual genera un periodo de preparación. Existen dos tipos de periodos de preparación:
a) la acumulación (causa) lleva a que haya un incremento en los precios (efecto)
b) distribución (causa), lleva a un detrimento en los precios (efecto).
Ley de Esfuerzo vs Resultado
El esfuerzo se trata, básicamente del volumen que maneja el activo. Hay una conexión entre el volumen y el precio del activo, por lo que podemos asegurarnos cómo será la tendencia a partir del análisis del mismo. Si vemos que no existe una conexión o lógica, o existen cambios que no podemos explicar, lo más probable es que la tendencia vaya a sufrir un cambio drástico próximamente.
Para identificarlo de forma sencilla:
- Gran volumen = gran esfuerzo
- Poco volumen/movimientos laterales en el mercado = poco esfuerzo
"Hombre Compuesto"
Una de las principales concepciones que tiene este método, es que reconoce la idea de un hombre compuesto. Qué es un hombre compuesto, te estarás preguntando? Es una representación imaginaria del mercado, que se supone que nos ayudará a comprender de forma más sencilla los diferentes movimientos que impactan y afectan a la fluctuación de los precios. De esta forma, y de ahora en más, pensaremos en el mercado como si estuviera manejado por una sencilla entidad y no por un grupo de grandes inversores o instituciones.
De toda la información y análisis que hizo Wyckoff, podemos saber que:
El Hombre Compuesto intentará que el resto de los inversores compren el mismo activo que él estuvo acumulando a precios mucho menores.
Si entendemos el comportamiento de este Hombre Compuesto, podemos predecir y anticiparnos al movimiento de los activos, siempre y cuando este método se practique con regularidad y se entienda a la perfección.
- Se supone que debemos analizar el mercado y los gráficos con la finalidad de comprender su conducta y las razones que hay detrás de cada uno de los movimientos.
Fases
Hay un ciclo de cuatro fases que este Hombre Compuesto realiza, podemos ver los diferentes momentos en el gráfico aquí arriba.
Acumulación: No hay mucha variación en precio y volumen, por lo que el mercado lateraliza. Aquí el Hombre Compuesto acapara la mayor cantidad de ese activo que pueda, antes que el resto de los inversores ingresen.
Tendencia alcista/Subida de precios: Una vez que la acumulación ha acabado, la oferta del activo comienza a hacerse escasa. El Hombre Compuesto intentará generar que el precio suba, ya que habrá un mayor movimiento con la llegada de los nuevos inversores. En el gráfico, veremos claramente que la demanda, en este momento, es mucho mayor. Puede ocurrir también que dentor de un periodo alcista, haya pequeños periodos de re-acumulación.
Distribución: Una vez más, el activo se encuentra lateralizando, ya que el Hombre Compuesto comienza a vender de forma gradual sus activos hasta que la demanda queda completamente satisfecha. Una vez que el precio llegó a su punto máximo, sólo quedan algunos compradores de último momento.
Tendencia bajista/Baja en el precio: Una vez que el Hombre Compuesto ha vendido sus activos, intentará presionar al mercado para que el precio baje nuevamente. En este punto, la oferta es superior a la demanda, ya que el resto de los inversores querrán vender sus posiciones también, ya que el precio se encuentra extremadamente a la baja.
Pasos para aplicar este método
Como hemos visto, hay muchas cosas a las que prestar atención al momento de aplicar este método. Es algo difícil al principio, hasta que entiendes la mecánica de cómo funciona.
1. Examina el mercado
Al principio, es realmente importante que juntes tanta información del mercado como puedas. Qué deberías buscar?
Tendencia: Define cómo se encuentra el mercado, la tendencia está al alza o a la baja? Mira cómo se encuentra el volumen de operación de los activos, es un momento en el cuál hay más demanda que oferta? Es un momento en el que hay más oferta que demanda? Es un momento en el cual el mercado está lateralizando?
Tu activo: Determina qué tan fuerte se encuentra y cuánto volumen de operatoria tiene, también deberías tener en cuenta si la moneda se encuentra siguiendo la tendencia del mercado principal o no. Deberías, idealmente, ir por aquellos activos que sí se encuentren siguiendo la tendencia.
2. Analiza tu gráfico
Una vez que juntaste suficiente información, es momento de analizar tu gráfico. En qué momento se encuentra? Qué puedes inferir a partir del volumen?
3. Compara tu activo
En el mundo de las criptomonedas, se hace un poco difícil comparar, pero lo ideal sería comparar la tendencia y tus deducciones con otro activo, por ejemplo BTC.
Ejemplo
Este es un gráfico de INCH/USDT con un marco temporal de 4H, indiqué todas las fases del método Wyckoff.
Acumulación: Se puede ver claramente cómo el mercado se encontraba lateralizando y cómo no hay mucho volumen. El precio se encuentra bastante estable y es claro que el ciclo ha comenzado.
Suba de precios: A pesar de que no ha sido una gran subida, específicamente porque el mercado no se encuentra en un momento de fuertes tendencias al alza, el volumen y el precio han subido consistentemente. También, podemos ver que hubo un periodo de re-acumulación antes que el precio toque su pico.
Distribución: El volumen incrementa nuevamente, pero el precio ya ha tocado su pico. Muchos inversores comienzan la venta de su tenencia.
Precios a la baja: Los precios caen e, incluso, podemos ver que han existido dos periodos de re-distribución.
Tarea para esta clase:
Comparte lo que has entendido del "Hombre Compuesto" y las leyes fundamentales. Cuál es tu punto de vista respecto a esto?
Comparte un gráfico de cualquier criptomoneda (no aceptaré BTC o ETH como ejemplos en esta tarea) y analizalos aplicando este método. Muestra de forma clara las diferentes fases, cómo cambian los volumenes y da detalle de qué es lo que ves.
Reglas:
- Tu artículo debe contener, como mínimo, 300 palabras. Sé creativo y que tu contenido sea de calidad.
- NO toleraremos plagio. No te apures a publicar tu tarea, oriéntate al detalle.
- Se aceptarán tareas hasta las 23.59hs del 5 de Junio de 2021. - UTC Time
- Entre las primeras cinco etiquetas, no olvides incluir las siguientes: #fendit-s2week8 y #cryptoacademy
- Según los criterios determinados por el equipo de Steemit, no recibirás un voto por tu tarea si tu reputación no es superior a 50 y no cuentas con 150 SP.
Cc.
@steemitblog
@steemcurator01
@steemcurator02

Hola @fendit aquí te envío mi articulo https://steemit.com/hive-108451/@ale.aristeguieta/steemit-crypto-academy-or-la-verdad-sobre-le-metodo-wyckoff-or-tarea-semana-8-or-fendit Creo que deberías hacer unos cuantos ajustes a tu escrito, espero seas justa corrigiendo mi publicación, y que leyendo mi escrito, puedas corregir el tuyo también. Saludos.
Alejandro Aristeguieta
Junior Ambassador in Nutbox
CEO and Founder of Trading Capital - Outreach medium for decentralized investors in the new financial era on Steemit
Hola profesora.
Por aquí mi tarea:
https://steemit.com/hive-108451/@josequintana/crypto-academy-week-16-homework-post-for-fendit-metodos-de-trading
Gracias de antemano!
Saludos estimada profesora mi tarea para usted bendiciones
https://steemit.com/hive-108451/@florni/crypto-academy-semana-16-tarea-el-metodo-wyckoff-hombre-compuesto-por-florni
Dear professor @fendit, kindly see the link to my homework task.
https://steemit.com/hive-108451/@benton3/crypto-academy-week-16-homework-post-for-fendit-by-benton3.
Thanks.
Hello professor @fendit. Here is my entry link for this week's task
https://steemit.com/hive-108451/@meniya/crypto-academy-week-16-or-homework-post-for-fendit-or-the-wyckoff-method
Nice lecture you gave, thanks for the teachings.
Hello Prof @fendit sir you have not grade my homework, thank in advance
https://steemit.com/hive-108451/@eberechi10/crypto-academy-week-16-homework-post-for-prof-fendit
Buenas noches esta es mi tarea de la semana gracias profesora @fendit por este tema tan maravilloso el tema del hombre compuesto.
https://steemit.com/hive-108451/@gema777/crypto-academy-week-16-homework-post-for-fendit-the-wyckoff-method-el-metodo-wyckoff
Thank you.
Thank you so much for the valuable lecture
Hello professor. My previous assignment post on the task given by you was not curated. Please, can you give me directions on what I should do in order correct the error.
Here's the link to the post
https://steemit.com/hive-108451/@uchescrib/crypto-academy-week-14-homework-post-for-fendit