Crypto Academy Week 16 - Homework Post for Prof. @fendit
Hello welcome to my homework on the Lecture delivered by Prof. @fendit of the department of crypto academy, the University of Steemit. The crypto academy has been a wonderful place to develop your knowledge and skills about trading or anything cryptocurrency and other blockchain related skills. This week topic of Prof. @ fendit lesson is on Wyckoff Method, and homework for this week asre as follows:-
Share your understanding on "Composite Man" and the fundamental laws. What's your point of view on them?
Share a chart of any cryptocurrency of your choice (BTC or ETH won't be taken into account for this work) and analyze it by applying this method. Show clearly the different phases, how the volume changes and give detail of what you're seeing.
I am go to start, first by explaining what is Wyckoff method, what is Composite Man, stating the fundamental laws and point out my own views. Also using a cryptocurrency chart to demonstrate Wyckoff Method. Thank you as patiently read through my homework.
NOW WHAT IS WYCKOFF METHOD?
This is a Method that was invented by Richard Wyckoff during the early years of 1930s. The method was name after the founder, Richard Wyckoff, this is how the Wyckoff came. The Wyckoff Method, is a method that has many principles and strategies to analyze market, and was originally develop to assist traders and investors in analyzing stock. We can also defind the Wyckoff Method as a theories and trading techniques use to analyze market directions. The Wyckoff Method, today has impacted greatly the modern day technical analysis, and have been applied into every financial markets of this era.
FUNDAMENTAL LAWS OF WYCKOFF
There are three fundamental laws of Wyckoff Method, which as following:-
- The Law of Supply and Demand.
- The Law of Cause and Effect.
- The Law of Effort vs. Result.
The Law of Supply and Demand
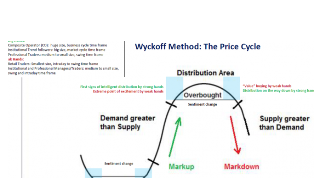
The law of Supply and Demand is the first law of Wyckoff Method and it states that prices rise only when the demand is greater than the supply, drop when the supply is greater than the demand. This law is the basic principles of even modern financial markets. For clarification, let we me use the below equation to make it more clear.
When Demand > Supply = The Price will rise
When Supply > Demand = The Price will drop
When Demand = Supply = No much price change.
This first Wyckoff is saying in a simple terms, that when demand more than supply, it causes prices to rise, in the sense that those who are buying is more than those selling. Likewise if those who are selling are more than those who are buying, this will cause the price to drop.
The Law of Cause and Effect
The Law of Cause and Effect is the second law of Wyckoff Method and it stated that differences between supply and demand are not event that just happened. The happen after a time range and occurred due the result of past events. In a simple terms, a time range of accumulation which call cause, which now leads to an uptrend, which is call effect. Likewise, a time range distribution which is also call cause, now leads to downtrend, which is call effect.
The Law of Effort vs Result
The Law of Effort vs Result is the third law of Wyckoff Method and it states that the changes in any asset’s price are as a result of an effort, which is the volume of trading. In a simple term, if the price is in accordance with the volume, the trend will continue. Likewise if the volume and the price are not significantly in accordance, then the market trend will stop or will change the direction of trending.
To clarify this further, BNB market begins to have high volume after coming from a very long bearish trend. Now with this high volume is a big effort, If it's sideway trends, it a small result. Now with this high volume of BNB, it indicates that people are now buying lot of BNB and no more price drops. Now in a situation like this, could mean that the price drop may be coming to an end, and upmark is around the corner.
THE COMPOSITE MAN CONCEPT
What is a Composite Man
A Composite Man is an imaginary representation of the market, which was proposed by Wyckoff help analyze the market. Wyckoff proposed this to investors and traders for use to analyze market as if it's one person that controls the market. It will now be easier for them to understand the trending of market. Putting it in a simple terms, the Composite Man is the biggest investors or you can also call them the market makers, wealthy individuals. Who will always act to there own best interest by buy at a low price and sell at a higher price. This is not the character of most retail investors, because the sometime loss money. But the Composite Man dont loss money like most retail investors because it uses a predictable strategy.
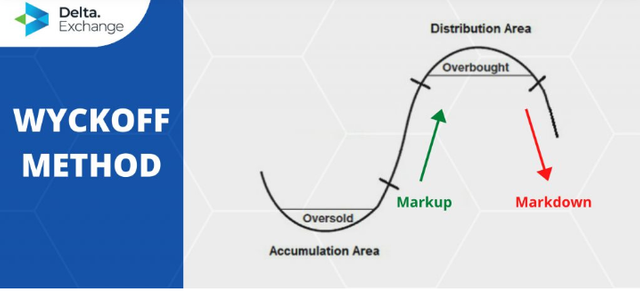
The Composite Man concept has four different main phases, which are Accumulation, Uptrend, Distribution, and Downtrend. Am going to illustrate a market cycle using this four phases of the Composite Man.
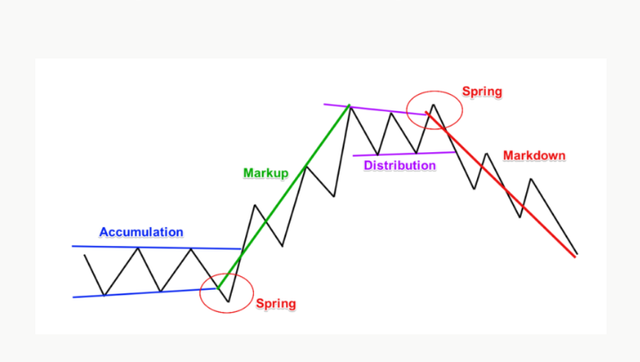
Accumulation
In this phase, the Composite Man accumulates assets before other investors know what was happening. In this phase, It's is marked by a sideways movement. This Composite Man accumulates the assets gradually so as not to cause significant changes in price
Uptrend
The phase, after the Composite Man has acquired enough assets, and by then sellers out of stock, the Composite Man will now cause the market to go up. Because the market is about to trend, this naturally attracts more investors to buy more assets, there by making the demand to increase the more.
Distribution
At this phase, the Composite Man now begin the distribution of his assets. He will be selling his assets to those just coming into the market. This phase is marked with a sideways movement.
Downtrend
This is the phase after the distribution phase, this is the were market starts going to the downside. Which is to say that, Composite Man after selling most of his assets, he starts the process of pushing the market down. This will then cause supply to be more than demand.
WAYS TO APPROACH THE MARKET USING WYCKOFF METHOD.
There are five ways which you can approach the market using the Wyckoff Method, these approach were develop based on the principles and techniques of Wyckoff. It's also demonstrates how you can practical put the Wyckoff Method to work.
- Determine the movement
You have to first understand and know the current trend and the direction it will probably go. Determine also the relation of supply and demand
- Determine the asset’s strength
You have to determine the strength of the relation between the assets and the market. How they are moving, are they going in same proportion or in different proportion?
- Look for assets with enough Cause
You also determine if there are great reasons why you should enter a position. The Cause, is it good to the point that will makes the rewards (Effect) worth taking the risks?
- Determine probably the move
Determine to Know it's time for the asset to move, and understand that position in a big movement. Understand also what price and volume are pointing to.
- Time your entry
Now you determine the best time you should enter, after you have analyze the stock and comparing it to market.
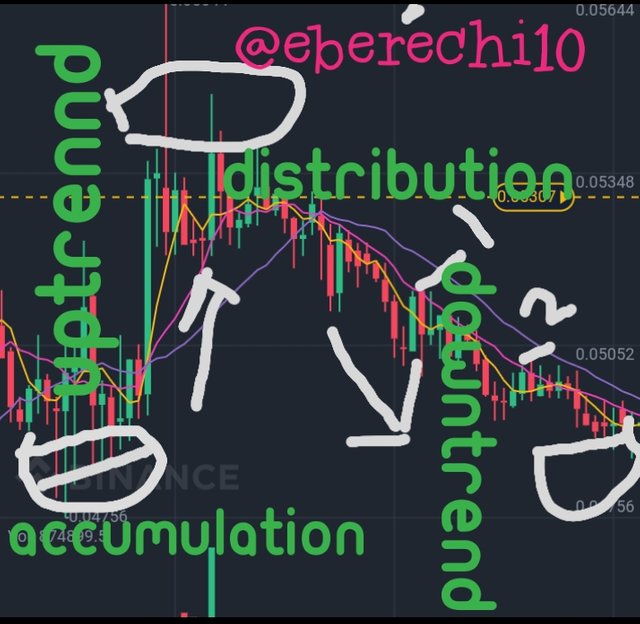
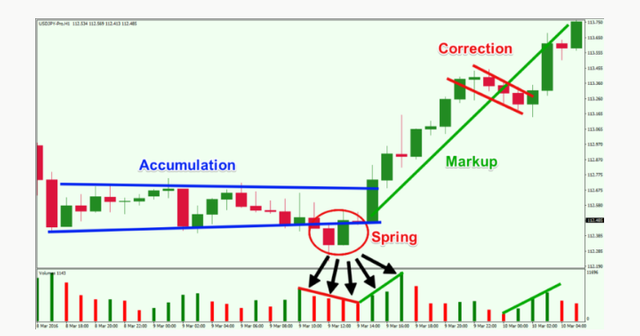
This is a 1hour chart of BTT/TXR and I will be using it to practice and put what I have learnt into work by analyze and showing the phases using the WYCKOFF METHODS.
- Accumulation
This is the accumulation phase, and from the chart, shows that there is a price sideways movement and the volume movement is not much. This is a clear evidence that the price is stable, which significantly shows the start of the cycle.
- Uptrennd
From the chart it shows that the assets had a very huge uptrend, which is due to the market's is in bullish. This causes price rise and volume increase up.
- Distribution
At this phase the assets price have reached it peak and investors start to selling.
- Downtrend
At the phase, price starts downtrend and as you can see where I mark 1 and 2, there were two slight distributions as the price goes down
CONCLUSION
The Wyckoff Method is still much relevant in this modern era, even after more than 90 years since it was developed. It is much more still in use than other Technical Analyzing tool, because it has a lot principles, theories, and trading techniques.
It also gives investors the opportunity to make logical decisions, while avoiding taking decision out of emotions. It provides tools that helps traders and investors to minimize risks and maximize the chance of success. But the truth remains that there is not yet proofed techniques which is 100% sure to succeed, at the moment. This is why you're are advise to trend with caution when investing in any assets. You must always be aware of the risks involve, most importantly when it's a cryptocurrency markets, because it is a very high volatile market.
Thank you for being part of my lecture and completing the task!
My comments:
Your work doesn't convince me that much.
Before submitting, make sure you reread what you have written, there are a lot of repetitions that cna be avoided and that makes your work a bit harder to get through.
The chart is a bit messy and hard to understand. I get to see and I don't know if you understood the concepts or just pointed out the words in the chart. As well as that, volume bars should have been included and the analysis could have been a bit more developed.
Overall score:
4/10
Ok thank you